Recycling, Reusing, Re-electing MPs in BC

Incumbency had an impact on seat retention for the parties in BC, with all four parties re-electing members.  The CPC did not do well retaining seats, but did even worse retaining seats where they did not have an incumbent MP.

Recycled MPs tend to do better for their political parties than otherwise

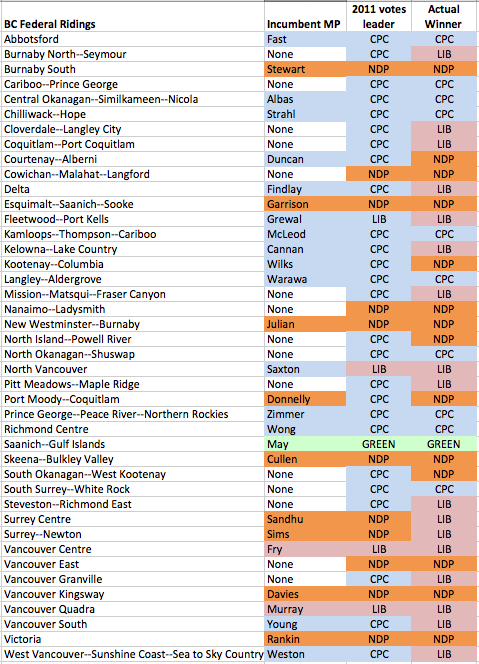
27 of 42 BC ridings had incumbent MPs

  • Only 7 of 15 CPC (47%) MPs re-elected
  • 7 of 9 NDP (77%) MPs re-elected
  • The 2 Liberals and 1 Green re-elected (100%)

Of the 8 defeated CPC incumbents, 6 were defeated by Liberals (five in Metro Van and 1 in Kelowna), 2 defeated by NDP (both outside Metro Van).  The NDP lost two incumbents to the Liberals in Surrey.

CPC lose their advantage in 15 non-held seats

Of the 15 seats with no incumbent MP, the Conservatives did the best in 2011 when transposing those results onto the new boundaries.

  • CPC had advantage in 12 of 15 seats; the NDP had advantage in 3/15.
  • CPC only won 3 of 12 seats (25%) in their advantage areas, a much lower percentage than in seats where the MP ran for re-election.
  • In non-incumbent seats, the NDP were 3/3 in seats where they held the advantage from 2011 and won 2 from the CPC.
  • The Liberals picked up 7 seats where the CPC held the advantage in non-incumbent seats.

Screen Shot 2015-10-27 at 8.41.16 AM

Geographic differences

The CPC incumbency advantage and 2011 vote advantage was under attack in Metro Vancouver by the Liberals and outside Metro Vancouver by the NDP (except in Kelowna where the Liberals stole a seat).

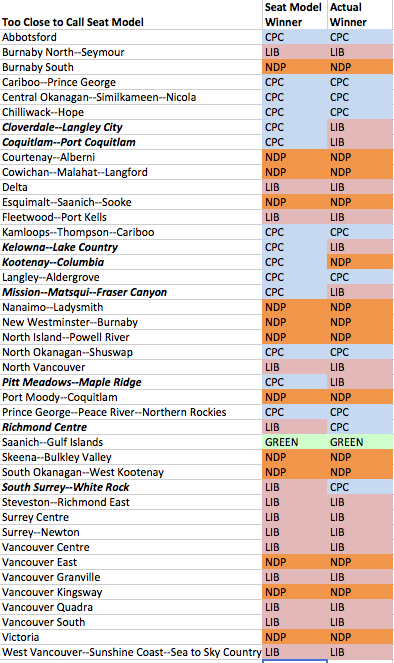
With 47% of CPC incumbents holding on, why not 47% of Conservatives in seats where they held an advantage?  Arguably incumbents did make a difference.  Would retiring MP James Moore have lost in a close 3-way fight?  Likely not.  Would Randy Kamp have held on in Pitt Meadows-Maple Ridge if he had ran again?  Quite possibly.  CPC incumbents in Cloverdale and Mission-Matsqui may have helped CPC hold those seats, but since the ridings were new, they didn’t have that luxury.

On the NDP side of the ledger, two NDP MPs in Surrey lost in blowouts.  No stopping the Liberal wave there (a South Asian Liberal wave?)  But in Burnaby-South, Victoria, Port Moody-Coquitlam, and Vancouver Kingsway, incumbency may well have been the key factor in saving those seats.  The political map of Metro Vancouver has a stubborn contiguous orange centre between East Van and Port Moody that is glued together by five NDP ridings, four of them with incumbent MPs and the other being Jenny Kwan, a longtime elected NDP MLA.  They won nowhere else in Metro Van.

Overall, the NDP withstood the Liberal wave in BC but failed to make necessary gains. They gave up two seats to the Liberals but took four back from the CPC.  Arguably, they held up to the Liberal onslaught due to incumbents, but also held their vote in seats where they had the underlying advantage.

In Alberta, the Oranges are crying the Blues

Wildrose + PC = Federal Conservative voters in Alberta, right?

Actually, it’s Wildrose+PC plus plus plus

Will the big bloc of federal blue voters drive over the Alberta NDP next election?

A few surprising things about the federal election in Alberta:

  • Almost a half-million more people voted in the federal election, compared to the May 2015 provincial election
  • Despite their huge win in May, the NDP lost votes compared to their previous federal effort in 2011, including a significant drop in ‘market share’
  • And the most surprising to me – the federal Conservatives had 375,000 more votes than the two ‘conservative’ provincial parties (PC and Wildrose) combined.

Chart: Comparing the 2015 Alberta provincial results to 2015 Alberta federal results in TOTAL VOTES.  Note: Wildrose and PCs combined and compared to federal CPC.

Alberta 2015P 2015F

For those who prefer the raw numbers:

Provincial Party 2015 AB PROV Federal Party 2015 AB FEDERAL Difference
NDP 603,459 NDP 224,198 -379,261
PC + Wildrose 773,082 CPC 1,148,649 375,567
Liberal 62,171 Liberal 473,661 411,490
Total Voters 1,486,901 Total Voters 1,929,197 442,296

So, 442, 296 more Albertans voted in the federal than the provincial, despite the fact that the Alberta provincial election was a once-in-a-generation change.  These ‘new’ voters didn’t necessarily march to the polls to trounce Harper – there was a bit of that – but many may have been small ‘c’ conservatives sitting out the provincial election.  While the provincial turnout was higher than normal at 58%, the federal turnout this month was 69%.

Comparing Alberta federal results: 2011 to 2015

Leaving the May 2015 provincial election aside for a moment, both the Conservatives and Liberals made gains in total votes, while the NDP was flat.  Because turnout was much higher, the NDP and Conservatives lost market share while the Liberals went way up.

Chart: Comparison 2011 to 2015 federal results in Alberta by VOTES

ab 2011 2015

Chart: Comparison 2011 to 2015 federal results in Alberta by market share

ab 2011 2015 %

The Liberals go way up in votes and market share; the Conservatives go up in votes and down in market share; and the NDP are flat in votes and go down in market share.

What does it all mean?

Well, you gotta be dispirited if you’re an NDPer.  On the surface, it makes the May 2015 results look very fleeting and surely there were hopes last May of a “Quebec-Alberta bridge” that could have delivered a federal NDP win, a’ la Mulroney 1988 and many PMs in the past.

Don’t despair, orange friends.  When you look at it a little deeper, a combination of federal NDP and federal Liberal voters makes for a significant voting bloc, one that is larger than the NDP vote from last May.

It’s a salivating prospect for non-NDPers in Alberta to consider how to harness the power of the federal Conservative voting bloc.  It remains the most dominant political base in the province, but has been divided provincially in recent years.  Also, just because some Notley voters would have voted CPC doesn’t mean they won’t return to Notley next election.

Governing well is the key to success for Premier Notley.  She will need to try to not awake the Beast – those million-plus federal Conservative voters.  She cannot do much to keep the conservative base from unifying – that’s on them, and it won’t be easy given the cultural differences at the provincial level between PCs and Wildrose.

On her end, she will be very keen to unite ‘progressive’ voters and appeal to those 473,661 federal Liberal voters that were energized by Justin Trudeau,  most of whom residing in Calgary and Edmonton who largely voted for her last May.  Putting all her eggs in the NDP-brand basket is a non-starter in Alberta.

The Premier of Alberta making nice with a Prime Minister named Trudeau… now that would be something.

Related:

 A panel discussion of the Alberta election hosted by the Broadbent Institute

Turnout and Chinese representation – Low and Low

By Gabe Garfinkel

In the final days of the federal election, respected community leader Tung Chan and Mike McDonald – publisher of this blog, contended that Chinese-Canadians’ voting intentions are not being adequately reflected by public opinion polls. Tung and Mike were right (as usual), but the problem of Chinese-Canadian participation in Canada’s electoral system goes beyond the polls.

The 2015 federal election demonstrated that Chinese-Canadians are not coming out to vote and Chinese-Canadian Members of Parliament are not being elected, proportionate to their numbers.

Let’s look at BC.

Hon. Alice Wong, re-elected in Richmond-Centre. One of two Chinese MPs from BC.

The five ridings with the highest Chinese population ranked in the top six lowest turnouts in the province. Richmond Centre, which holds highest percentage of Chinese-Canadian citizens (44.3%) in the province, had the lowest voter turnout (59.0%).
The top ten ridings with the highest Chinese-Canadian populations all fell within the sixteen ridings with the lowest voter turnout. The ridings with the highest Chinese populations correspond to the ridings with the lowest voter turnout. Period.

Riding Percentage Chinese Population Ranking (out of 42) Percentage Voter Turnout Voter Turnout BC Ranking (out of 42)
Richmond Centre 44.31% 1 59.0% 42
Vancouver Kingsway 32.50% 2 63.6% 38
Vancouver South 32.23% 3 63.7% 37
Steveston-Richmond East 29.67% 4 60.4% 41
Burnaby South 28.29% 5 61.0% 40
Vancouver Granville 24.66% 6 68% 32
Vancouver East 19.91% 7 66.9% 34
Burnaby-North Van Seymour 18.36% 8 70.0% 27
Vancouver Quadra 18.03% 9 68.5% 30
Coquitlam-Port Coquitlam 12.73% 10 67.3% 33
New West – Burnaby 11.69% 11 66.6% 35

Voting and polls only tell part of the story of Chinese-Canadians’ low participation in the electoral process. Of the 338 new MPs arriving in Ottawa, only five are of full Chinese descent and only three are in the new Liberal government: Arnold Chan (Scarborough-Agincourt), Shaun Chen (Scarborough North) and Geng Tan (Don Valley North). There is not a single Liberal Government MP of Chinese descent in BC, a province with over 430,000 Chinese-Canadians in Metro Vancouver alone. As Tung Chan stated, “Across BC, over 1 in 9 are Chinese”. Yet, only 2 of 42 BC MPs are Chinese. Alice Wong (CPC – Richmond Centre) and Jenny Kwan (NDP – Vancouver East) are the sole Chinese-Canadian MPs in BC.

Alone, the statistics are indeed surprising. When looked at comparatively with another large ethno-cultural population in Canada, they are shocking.

There are approximately 1.6 million South Asians in Canada, slightly more than the 1.4 million Chinese-Canadians. Sikh Indo-Canadians have famously participated in Canada’s democratic process since the 1970’s. The 2015 federal election elected the most South Asians in Canada’s history – twenty. That is four times (!) the amount of elected Chinese-Canadian MPs, eighteen of whom are in the Liberal Government.  Four of BC’s 17 Liberal MPs are Indo-Canadian.

As heartening it is to see one minority group in Canada participate in democracy, it is equally disheartening to see another not being fully represented. We can speculate that other forms democratic engagement – volunteering, party membership and political donations – are also disproportionately low amongst Chinese-Canadians.

Not all communities participated at an equal level during the election that saw a high voter turnout.

Gabe Garfinkel is a communications and public affairs consultant with FleishmanHillard Vancouver. He has held senior positions in government and on political campaigns advising on multicultural communications, media, and policy. (Gabe and I worked together once-upon-a-time, I appreciate his contribution to the debate – Mike)

Conservatives held their vote but lost market share

Did the Conservatives crash?

No. They had 96% of the votes they received when they won a majority in 2011.  Had the number of voters stayed the same, they would have received 36% of the popular vote.

However, the market expanded.  An additional 2.7 million Canadians voted, pushing voter turnout from 61.1% to an estimated 68.5%.

Chart: Total votes by party from 2006 to 2015

2006 2015 votes

The blue line is remarkably consistent over four elections, ranging from a low of 5.2 million (2008 minority CPC government) to 5.8 million (2011 majority CPC).  The total number of CPC votes in 2015 was higher than minority governments in 2006 and 2008.

The absolute number of votes for the Greens has declined and levelled off.  The Bloc continues its decline in overall voters.  More seats this time, but that was thanks to a four-way fight in Quebec.

The NDP can take some solace that they had the second most votes in the history of their party, almost a million more than Jack Layton’s campaigns in 2006 and 2008, but over a million less than the breakthrough 2011 campaign.

Then there’s the Liberals.  After successive declines, 2015 blew the roof off of their support eclipsing the steady Conservatives.

On the surface, the 250% increase in Liberal support can be attributed to stealing market share from the NDP but moreso in terms of increased voter turnout overall.

Five BC ridings where strategic voting organizations got it wrong… and other monkey business

One reason why political party organizers don’t like strategic voting organizations is that they are likely to get it wrong when it comes to polling.

In five BC ridings, they did just that.  In two of those ridings, a Conservative was elected.  In three other ridings, they picked the NDP and the riding went Liberal in close three-way battles.  They could have screwed those up too, if their aim was really to “STOP HARPER”.

Cariboo-Prince George

Leadnow recommended NDP Trent Derrick based on Environics polling.  He finished third.  Final result: CPC 36.5%; Liberal 31.6%; NDP 25.9%.  Oops!  As of October 9-11, they had the Conservatives at 30% – they finished with 36.5%.  I guess it was that late Blue surge?

North Okanagan – Shuswap

Leadnow recommended NDP candidate Jacqui Gingras.  Again, it was the Liberal who had the best chance to win.  CPC candidate Mel Arnold won with 39%, with the Liberals second at 30% and NDP at 26%.  Yet the Environics polling had it at 37% NDP and 33% CPC, while Leadnow also published poll results from a firm called Oracle that had the Liberals at 12%!  They messed up and got it wrong.

Here’s three seats that the Liberals won despite inaccurate and confusing poll data indicating otherwise:

Burnaby North – Seymour

Liberal Terry Beech won the seat with 36.2% of the vote, winning by about 7 points.  Leadnow reported that the Liberal had the best chance, but on October 15th, Dogwood released a stale poll from Insights West (Oct 5-10) that had the Liberals third at 17%.  Wrong call, bad polling, and, frankly, reckless.

Coquitlam – Port Coquitlam

Leadnow recommended NDP candidate Sara Norman and released poll results (Environics, Oct 9-11)  claiming she led the race with 38%.  Well… turns out the Liberals won the dang seat and the NDP were third.  Libs 35%; CPC 32%; NDP 27%.

Pitt Meadows – Maple Ridge

The riding I grew up in – it hadn’t elected a Liberal since they lost to the federal Socreds in the 1950’s!  Until yesterday.  Leadnow promoted a September poll that had the NDP at 41% compared to the Liberal at 19%.  Might have been true… then.  Election night?  Liberals 33.8%, barely edging the CPC at 31.4%, with the NDP pulling up third at 29.6%.  Close shave.

Other controversy…

The Vancouver-Granville brouhaha has been well documented.  Leadnow endorsed NDP Mira Oreck.  From the standpoint that they had written off the Conservatives, they were correct.  Liberal Jody Wilson-Raybould won the race handily, as predicted, but Leadnow left a lot of people confused as to their definition of strategic voting.

The Leadnow website simply listed the NDP MP in Surrey-Centre as the choice.  From the standpoint that the CPC were out of the running, they were correct, but it was the Liberal Randeep Sarai who won.  The same almost happened in Burnaby South where up-and-comer Liberal Adam Pankratz almost nipped off NDP MP Kennedy Stewart, who was promoted on the Leadnow website. These examples are not such a big deal but Liberals might feel a little peeved.

What’s the point?

Five ridings is a lot of ridings to get wrong.  They basically played into the hands of the Conservatives, and helped elect two of them by sending mixed signals.

I’m sure there are some chagrined Liberals who saw the endorsements or promotion of the NDP undermine their more legitimate chances of winning.

As well, the polling that was done by Dogwood lacked transparency.  They did not release cross-tabs to the public, which should be common practice for all publicly released polls.  I will credit Kai Nagata of Dogwood for opening a dialogue on polling issues and stating that they are going to learn from the experience.  We’ll see.

My advice:

Releasing polling data is very risky unless you are committed to doing it right.  Doing it right is NOT doing it on the cheap nor is it doing it well before voters have made up their minds.  Of course they were wrong!  The Liberals surged and rendered their polling info useless except for the fact it served to mislead voters as to who had the best chance.  Why they were polling in May and over the summer, I will never know.  They simply wasted their donors’ money and misguided their own strategy.

Too Close To Call seat model was close enough in BC

One of the more interesting election websites is “Too Close too Call” – an election forecast site produced by Bryan Breguet, a Ph.D student in Economics at UBC.  I haven’t met him but admire his work.

It seems like he’s beating himself up a bit about his predictions today.  I took a spin on his seat forecasting model and inputted the actual popular vote numbers from BC.  His model extrapolates the final results fairly accurately.  Seat forecast models basically extrapolate the new pop vote numbers on a platform of the previous pop vote numbers (2011).

Here is the result:

Screen Shot 2015-10-21 at 2.05.47 PM

His accuracy is 81% (34 out 42).  Not bad.  That’s a B in most schools.

What interests me are the differences – why do some ridings break the pattern?

In BC, those eight ridings – based on Too Close too Calls model – are:

  • Cloverdale-Langley City
  • Coquitlam-Port Coquitlam
  • Kelowna – Lake Country
  • Kootenay-Columbia
  • Mission-Matsqui-Fraser Canyon
  • Pitt Meadows-Maple Ridge
  • Richmond Centre
  • South Surrey-White Rock

I will offer a theory:

  • These were all CPC seats to begin with
  • Five of eight seats did not have an incumbent seeking re-election.  (Conservatives lost 4 of 5 with new candidates)
  • The Conservatives won two of the seven outliers
    • Richmond Centre – bucked the trend for the CPC because of incumbency advantage.  Possibly retaining stronger support among Chinese.
    • Dianne Watts bucked the trend in South Surrey because she was a much better candidate for CPC than her predecessor.
  • Kootenay-Columbia was going to be close under these circumstances, though the NDP outperformed there, defeating a CPC incumbent in a squeaker.
  • Kelowna-Lake Country was a Liberal surprise, perhaps reflecting changing demographics in BC’s most urbanized Interior City.

Candidates make a difference, especially incumbents.  A closer look at popular vote per riding based against the model would show this too, but it’s the winning and losing that matters most.

Magnitude of Liberal gains highest in 4 western provinces

By order of magnitude, the biggest Liberal gains were in the four Western provinces.

Liberal popular vote increased by 2.6X to 2.8X in each of the four western provinces.  Nationally, the Liberal vote doubled.

Lib magnitude provinces

Sk 2.8
Mb 2.7
Ab 2.6
BC 2.6
Que 2.5
NB 2.3
NS 2.1
Ont 1.8
Nfld 1.7
PEI 1.4
National 2.1

Popular vote increases:

2011 2015 DIFF Magnitude
Sk 8.6% 23.9% 15.3% 2.8
Mb 16.6% 44.6% 28.0% 2.7
Ab 9.3% 24.6% 15.3% 2.6
BC 13.4% 35.2% 21.8% 2.6
Que 14.2% 35.7% 21.5% 2.5
NB 22.6% 51.6% 29.0% 2.3
NS 28.9% 61.9% 33.0% 2.1
Ont 25.3% 44.8% 19.5% 1.8
Nfld 37.9% 64.5% 26.6% 1.7
PEI 41.0% 58.3% 17.3% 1.4
National 18.9% 39.5% 20.6% 2.1

Trudeau’s voter coalition stronger in BC and MB than Chretien’s 1993 win

The last time the Liberals defeated an incumbent Conservative government was in 1993.

Jean Chretien’s Liberals took 41.2% of the vote compared to Justin Trudeau’s 39.5%.  Similar.

The regions tell an interesting story.  Justin did 6.4% better in BC than Chretien, 9.9% better in Nova Scotia, and 10.3% better in Manitoba.  Chretien was higher in Ontario and Quebec (marginally).

In terms of BC, Chretien took six seats in 1993; Trudeau took 17 in 2015.

Chart: Comparison of Liberal Popular vote by province – 1993 and 2015

1993 2015 LIB

1993 2015 DIFF
BC 28.8% 35.2% 6.4%
Ab 24.0% 24.6% 0.6%
Sk 24.7% 23.9% -0.8%
Mb 34.3% 44.6% 10.3%
Ont 49.5% 44.8% -4.7%
Que 36.7% 35.7% -1.0%
NB 56.0% 51.6% -4.4%
NS 52.0% 61.9% 9.9%
PEI 60.1% 58.3% -1.8%
Nfld 67.3% 64.5% -2.8%
National 41.2% 39.5% -1.7%

Lib win ‘over’ the over-under line

I wrote about the Over-Under line for majority and minority governments back on October 1st.

No government has won a majority with less than 38.5% of the popular vote in the past 60 years.  One government (Pearson) had a minority with 41.5%, so the over-under line was described as 38.5% to qualify for a majority and 41.5% to guarantee it.

The Liberals led by Justin Trudeau garnered 39.5% of the popular vote, falling within the range of many other majority governments in Canadian history, garnering the seats without needing to cross the 41.5% threshold.

Slide1