BC final count seat flips

It comes down to math: how slim is the margin and how many votes are outstanding? US election? No, we’re still Biden time waiting for the British Columbia final count.

In the seven closest seats where BC Liberals are leading, two require a slight deviation from Election Day results to flip the results to the NDP – Vernon-Monashee and Abbotsford-Mission.

Vernon-Monashee incumbent MLA Eric Foster leads by 0.9% while the pile of outstanding votes represents 31% of total ballots. Therefore, the NDP challenger needs to win the remaining pile by 2.1% to win (an overall swing of 3%). In Abbotsford-Mission, NDP challenger and Mission’s Mayor Pam Alexis needs to win the remaining pile of votes (29% of all votes) by 2.5%, a modest swing of 3.6% compared to the Election Day count.

The NDP needs to win the remaining pile of votes in Vancouver-Langara and Surrey-White Rock by 7% and 7.4% respectively, which would be swings of 12.8% and 11.7% respectively.

Surrey South, Kamloops-North Thompson, and Fraser-Nicola look on the outer realm of possibility given the 18%-20% swings required to flip the seats orange.

What about the ridings with slim NDP leads? ‘Everyone’ assumes the NDP have an advantage on mail-in and absentee, but there is one riding where the margin is razor-thin: Richmond-South Centre.

BC Liberal Alexa Loo trails the NDP’s Henry Yao by 124 votes or a 1.5% margin. While there are only 5,280 ballots to be counted, there were only 8,150 votes counted on Election Day. Almost 40% of the total votes are yet to be counted and Loo needs to win the remaining pile by 2.3%. This is when you wonder at what point in the campaign people cast their vote, and whether there might be cultural or demographic differences in the make-up of voters that push the outcome to Loo or Yao.

It’s a tougher slog for other BC Liberal candidates, who require double-digit swings in order to overtake their adversaries. In Vancouver-False Creek, over half of the votes are yet to be counted. Is there a Sam Sullivan factor given his high name recognition? He needs a 12.7% swing.

Parksville-Qualicum’s incumbent MLA Michelle Stilwell has the highest number of outstanding votes to be counted, among the close races. With 13, 308 outstanding votes, representing 42% of the total, Stilwell is hoping that her base of older supporters went to bed early and voted-by-mail. She needs a 12.2% swing. Similarly for newcomers Matt Pitcairn in Richmond-Steveston who needs a 12.1% swing to overtake the NDP’s Kelly Greene, while Margaret Kunst needs an 11.3% swing in Langley East to topple the NDP’s Megan Dykeman.

The riding of Chilliwack-Kent will resolve itself in the final count as incumbent MLA Laurie Throness trails the NDP’s Kelli Paddon by 195 votes or a 1.2% margin. Throness is no longer a part of the BC Liberal fold, but he may still benefit from votes cast by mail earlier in the campaign by voters who assumed they were voting for him on that basis. It will be one of the top 4 closest ridings to watch.

Talking BC politics on the Herle Burly

It was an honour to be asked to appear on the Herle Burly to talk about the recent BC election. It’s a wide ranging hour-long interview preceding the weekly Herle Burly political panel.

David Herle launched Canada’s premier podcast prior to the 2019 federal election. Along with his crew, Jenni Byrne and Scott Reid, they are a good listen because they’ve been there – they know campaigns, politics, and government from the inside out. They know how to win and they have been cut down hard by the voters too. Don’t trust a politico who says they always win! It means they don’t stick around for the hard times.

David was an ‘old’ Young Liberal when I came onto the scene in the mid 1980s. Like me, he was raised in a part of the country (in his case, Saskatchewan) not known for generating Liberals, especially in the 1980s. At my first national convention in 1986, he was the outgoing president of the Young Liberals of Canada, and soon to be at the very heart of Paul Martin’s brain trust. David guided Mr. Martin through leadership campaigns, one of the most successful reigns as Finance Minister in Canadian history (if not the most), and during his prime ministership.

Have a listen… and subscribe to the Herle Burly to keep informed and entertained.

If you watch the YouTube version, note the carefully curated stack of books – some great picks on BC / Canada for you:

BC history/politics

  • Canyon War, by Daniel Marshall
  • Sojourners in the North, by Lily Chow
  • Breaking Trail, Len Marchand’s bio with Matt Hughes
  • At the Bridge, by Wendy Wickwire
  • Art of the Impossible: Dave Barrett and the NDP in power 1972-1975, by Geoff Meggs and Rod Mickleburgh
  • Vancouverism, by Larry Beasley

Canadian history/politics

  • Big Tent Politics, by Ken Carty
  • Elusive Destiny: the political vocation of John Turner, by Paul Litt
  • Sir Wilfrid Laurier and the romance of Canada, by Laurier LaPierre
  • Vimy, by Pierre Berton
  • Contenders, by Allan Gregg, George Perlin, and Patrick Martin

Would have also included All-Native by Rudy Kelly, and He Moved a Mountain: the Life of Frank Calder and the Nisga’a Land Claims Accord, by Joan Harper, if I hadn’t loaned them out!

BC Election from 1 to 87

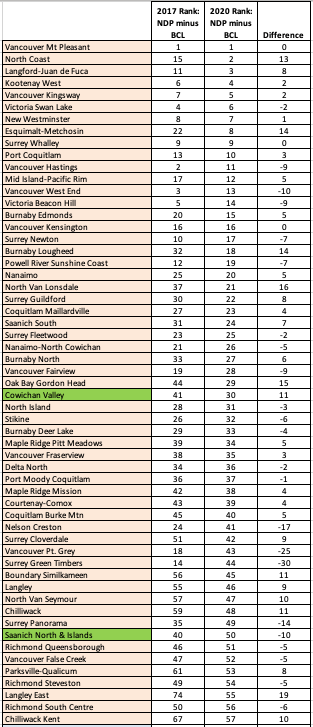
Which were the strongest NDP and BC Liberal seats? When measuring the difference in vote percentage between the NDP and BC Liberals, once again, Vancouver Mt. Pleasant came out on top.

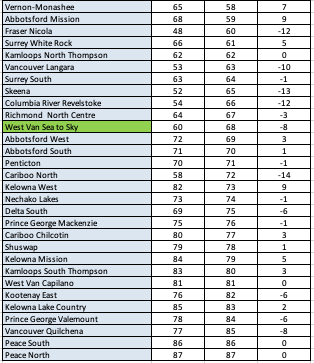
Based on Election Night numbers, the NDP outdistanced the BC Liberals in 57 seats (finishing ahead of the BC Libs in two seats that elected a Green). The BC Liberals prevailed over the NDP in 30 seats (including one seat that elected a Green).

Thus, the dividing line, so far, between the NDP and BC Liberals is between Chilliwack-Kent (NDP leading) and Vernon-Monashee (BC Liberal leading). Chilliwack-Kent is a bit complicated, so you can back up one seat and you have the NDP leading BC Liberal Alexa Loo in Richmond South Centre. That riding would be the 54th NDP seat and Chilliwack-Kent the 55th.

The left hand column (2017) measures the NDP-BC Liberal difference in the previous election, then the 2020 difference, and third column reports how many places each riding moved in terms of its relative rank. For example, North Coast went from 15th best NDP riding in 2017 to 2nd best in 2020, based on the initial count, while Vancouver-Point Grey dropped from 18th best to 43rd best (UBC students at home? spec tax? or see further below). I’m also interested to know why Surrey-Green Timbers dropped from 14th best to 44th. Those examples aside, the only metric that really matters for the NDP is that they lead the BC Liberals and Greens in 55 seats.

As for the BC Liberals, where you see #40 to #57, those are mainly ridings that they need to win next time to form government and many of them are seats they traditionally won from the 1990s until Saturday. However, the first step is to stop going in the wrong direction, and sliding down the chart.

Some ridings that they lost actually did better, relatively speaking. While Jas Johal lost the initial count by about 900 votes, Richmond-Queensborough actually dropped on the NDP depth chart. Based on difference between NDP and BC Liberal votes, it went from 46th best NDP riding (an NDP loss) in 2017 to 51st best NDP riding in 2020 (an NDP win). A rising tide lifts all boats, or some of them to victory anyway. None of this is much consolation to Jas!

While Dan Davies in Peace River North had the largest margin over the NDP, his actual challenger was BC Conservative leader Trevor Bolin, who netted 35% of the vote. The above table isn’t then an exact indicator of ‘safeness’ when third parties and independents are in the mix, but it does at least establish that Peace North is not painted orange.

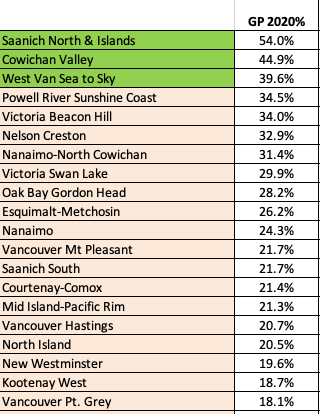
What about the Greens? They complicate my table so I will deal with them separately. Let’s look at their top 20 seats by popular vote.

Their best three showings in terms of popular vote were the three wins, but they also had another four ridings over 30%: Powell River-Sunshine Coast, Victoria-Beacon Hill, Nelson-Creston, and Nanaimo-North Cowichan. This is a longer list of winnable Green seats than seen before.

In fact, after their three wins, the next 17 best showings are all in NDP seats. Only one of these Top 20 seats elected a BC Liberal in 2017 (West Vancouver-Sea to Sky).

The good news for the NDP is that they still won 17 of these 20 seats in spite of the Greens taking a significant chunk (and this does explain David Eby’s lower popular vote). The Greens eclipsed the BC Liberals in many Island ridings. The bad news for the NDP is that they have a renewed Green Party in the NDP heartland and there is no nicey-nicey CASA arrangement going forward. It will be interesting to see how the NDP and the Sonia Furstenau-led Greens interact at the old rockpile on Belleville Street.

How Popular Vote = Seats

WARNING. This is a dark art.

BC election results usually follow the pattern of the previous election – the strongest and weakest ridings for each party generally stay the same, but there are exceptions, of course.

If one applies various popular vote scenarios to the previous map, you can see how the seats move. Thus, I applied popular vote scenarios for the NDP and BC Liberals to the 2017 map and produced seat estimates.

As you can see below, 40% for NDP and 40% for BC Libs produces the seat count from 2017 – 43 BC Lib, 41 NDP, and 3 Green.

If, when this is all done, the NDP have 46% and BC Libs 37%, then the dart lands 50 NDP seats, 35 BC Lib, and 2 Greens. If BC Libs win 41% of the vote and NDP 39%, then it’s a BC Lib majority of 45 seats to 39 seats. Since the polls have mainly showed NDP leads, most of the scenarios have NDP majorities. However, if the BC Libs exceed 46% of the popular vote tonight, I will be delighted to update my blog post.

Exceptions, exceptions, exceptions. I know, I know. This is a crude, one-size-fits-all approach. While this model does not show it, it is possible for the BC Liberals to win a plurality of seats while losing the popular vote if regional differences become more pronounced. For example, if BC Libs win seats by small margins, especially in rural BC, but get blown out in NDP strongholds, that could happen. The reverse took place in 1996 when Glen Clark led the BC NDP to a majority government despite losing the popular vote by 3 points.

I prefer a more regionalized model that is more fine-tuned to shifts within urban-suburban-rural audiences. But, that’s a lot of work, and I need to have dinner. Can’t blog on an empty stomach … especially on Election Night.

The most ‘outstanding’ ridings

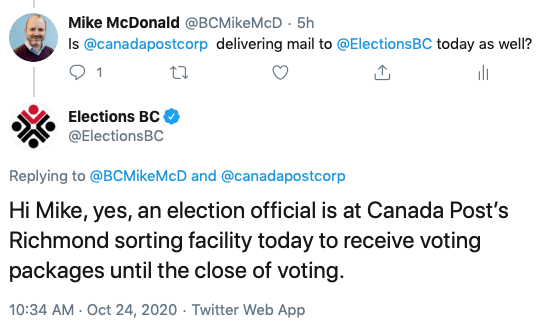
How many votes will be outstanding as of tonight? And which are the most ‘outstanding’ ridings? As of midnight Election Eve, almost 500,000 vote-by-mail ballots had been received with more coming today. Elections BC confirmed that representatives are stationed at the Canada Post sorting facility on Sea Island, ready to collect all available ballots before 8pm PT.

(Just wondering, is it just one guy in a 1991 Toyota Corolla picking up the ballots, and throwing them in the trunk of his car, or is there like a super secret Elections BC Swat team with laser guns, defending democracy against any external threat?)

It’s not just mail ballots either, there are also special voting ballots, absentee voting in and out of electoral district, absentee advance voting, and alternative absentee voting (in DEO office). Last election, those categories added up to over 173,000 votes cast. So, this time we can expect at least 600,000 more ballots to be counted after Election Night (500,000+ mail and 100,000+ absentee).

2017 election:

Which are the most ‘outstanding’ ridings? The other day, I posted about the ‘early birds’ – those voting in advance polls or by mail. Advance poll votes are counted tonight. Mail plus the categories listed above will be counted in November as part of the final count.

I was interested to know which ridings will have the most ballots to be counted as a percentage of ‘expected voters’. I calculated this by taking the current number of registered voters (7% higher compared to 2017) and multiplying it by the turnout percentage per riding from 2017. This is imperfect, but does help estimate how many will show up to vote this time if turnout rate is consistent per riding (it was 61% across BC in 2017, but ranged from a high of 74% in Saanich North & the Islands to a low of 47% in Richmond South Centre).

The ridings with the highest number of outstanding mail ballots will make November a bit more interesting, less certain, and a lot more nerve-wracking in ridings where there is a close race. The lower the number, the more certain one can be on Election Night about the final outcome.

My estimates of the proportion of outstanding ballots (vote-by-mail only) as as a percentage of the estimated number of voters per riding:

RidingMail as % of expected votes
cast per riding
Victoria Beacon Hill42%
Oak Bay Gordon Head37%
Vancouver Fairview36%
Vancouver False Creek36%
Victoria Swan Lake35%
Saanich South34%
Vancouver Pt. Grey34%
Vancouver Quilchena33%
Esquimalt-Metchosin32%
Vancouver West End32%
Saanich North & Islands31%
Vancouver Mt Pleasant30%
Parksville-Qualicum30%
Port Moody Coquitlam30%
Vancouver Langara30%
New Westminster29%
Langford-Juan de Fuca29%
Surrey South29%
Vancouver Hastings29%
North Van Seymour29%
West Van Capilano28%
Courtenay-Comox28%
Nanaimo27%
Vancouver Kensington27%
Richmond South Centre27%
Surrey White Rock27%
Richmond Steveston27%
Vancouver Fraserview27%
Richmond North Centre26%
Burnaby North26%
Coquitlam Burke Mtn26%
Surrey Cloverdale26%
Vancouver Kingsway26%
Port Coquitlam26%
North Van Lonsdale25%
Burnaby Lougheed25%
Kelowna Lake Country25%
Langley East25%
Burnaby Deer Lake24%
Nanaimo-North Cowichan24%
Coquitlam Maillardville24%
Langley24%
Penticton24%
Burnaby Edmonds24%
Kelowna Mission23%
Delta South23%
Cowichan Valley23%
Maple Ridge Mission22%
Maple Ridge Pitt Meadows22%
Surrey Panorama22%
Richmond Queensborough22%
Kelowna West22%
Abbotsford South21%
Kamloops North Thompson21%
West Van Sea to Sky21%
Chilliwack Kent 21%
Surrey Guildford21%
Abbotsford Mission21%
Powell River Sunshine Coast21%
North Island20%
Vernon-Monashee20%
Delta North20%
Surrey Fleetwood20%
Chilliwack20%
Surrey Newton19%
Mid Island-Pacific Rim19%
Surrey Whalley19%
Surrey Green Timbers18%
PG Mackenzie17%
Abbotsford West17%
PG Valemount16%
Boundary Similkameen16%
Shuswap15%
Nelson Creston15%
Kootenay West14%
Cariboo Chilcotin14%
Columbia River Revelstoke14%
Kamloops South Thompson14%
Kootenay East13%
Cariboo North11%
Fraser Nicola11%
Skeena9%
Stikine9%
Nechako Lakes8%
Peace North8%
North Coast7%
Peace South6%
Provincial average
(vote-by-mail as % of expected voters )
24%

Remember, I didn’t account for the other absentee and special ballots in this table so you can probably add about 5%, conservatively, to the number of outstanding provincial ballots. In Oak Bay-Gordon Head last election, there were over 2,400 absentee and special ballots (not counting mail) and in Courtenay-Comox there were almost 2,000, which happened to decide the outcome of government.

When you at your own personal Decision Desk tonight ready to ‘call it’, you might want to check my chart.

BC voters up with the roosters

As of October 23rd, over a million early birds had flocked to the polls in British Columbia – 681,055 at advance polls and almost 500,000 vote-by-mail packages have already been received. Combined, that’s over half the amount that voted in 2017 when about 2 million flew to the polls, mainly on Election Day.

Cock-a-doodle doo … time to vote

Province-wide, about 33% of registered voters have voted or their mail ballots have already been received. Last election, the voter turnout was 61% – so, likely half of the ballots this time are already in. The percentage of early bird voters will increase as mail ballots continue to arrive prior to Saturday at 8pm.

I looked at early birds riding-by-riding by calculating the percentage of advance poll voters per riding and adding the estimated number of mail ballots received per riding (as of October 22) to determine number of early bird voters. (The estimate of mail ballots is Mail Packages requested * 54% – the amount returned by October 22, province-wide). UPDATE – the number of mail ballots received as of October 23 is now 478,900 (66% of packages requested).

Where are the early birds? It looks like they are nesting on the Island. Two of the top three early bird ridings in BC elected Greens in 2017.

Riding
(Colour coded by winning party, 2017)
Adv% Mail ballot return estimateCombined Advance+Mail  (est.)   Oct 22
Parksville-Qualicum26%16%42%
(now 46%, Oct 23)
Saanich North & Islands24%18%41%
Oak Bay Gordon Head20%21%41%
Esquimalt-Metchosin25%16%41%
Vancouver Pt. Grey24%17%41%
Victoria Beacon Hill18%21%39%
Courtenay-Comox24%14%39%
Victoria Swan Lake21%18%38%
North Van Seymour22%16%38%
Saanich South19%19%38%
Vancouver Fairview19%18%37%
Boundary Similkameen29%8%37%
Delta South24%13%37%
Surrey White Rock23%14%37%
Penticton25%11%36%
Langford-Juan de Fuca22%14%36%
North Van Lonsdale23%13%36%
Cowichan Valley24%12%36%
Vancouver West End21%14%35%
Nanaimo-North Cowichan23%12%35%
West Van Sea to Sky24%10%34%
West Van Capilano20%14%34%
Port Moody Coquitlam18%15%33%
Nanaimo20%13%33%
Kelowna Mission23%10%33%
Maple Ridge Pitt Meadows22%11%33%
Burnaby Lougheed21%12%33%
New Westminster18%14%33%
Vancouver Quilchena17%16%32%
Surrey Fleetwood23%9%32%
Langley East20%12%32%
Columbia River Revelstoke25%6%32%
Port Coquitlam19%12%32%
Surrey South18%13%31%
Shuswap23%7%31%
Vancouver False Creek16%15%31%
Kootenay East25%6%31%
Surrey Cloverdale18%12%31%
Coquitlam Maillardville19%11%31%
Kelowna Lake Country20%10%31%
Mid Island-Pacific Rim21%9%30%
Coquitlam Burke Mtn19%12%30%
Cariboo Chilcotin23%7%30%
Kelowna West21%9%30%
Nelson Creston22%8%30%
Langley19%11%30%
Chilliwack Kent 20%10%30%
Powell River Sunshine Coast18%11%29%
Maple Ridge Mission19%11%29%
Fraser Nicola24%5%29%
Burnaby North17%12%29%
Delta North19%10%29%
Richmond Steveston16%13%29%
Surrey Panorama18%10%29%
Abbotsford Mission19%9%28%
Vernon-Monashee19%9%28%
Vancouver Hastings15%13%28%
Abbotsford West21%7%28%
Skeena23%5%28%
Kamloops North Thompson18%10%28%
North Island18%10%28%
Vancouver Fraserview15%12%28%
Vancouver Langara14%13%27%
Richmond Queensborough18%9%27%
Vancouver Kensington15%13%27%
Abbotsford South18%9%27%
Kamloops South Thompson20%7%26%
PG Valemount19%7%26%
Vancouver Kingsway16%11%26%
PG Mackenzie19%7%26%
Peace North23%3%26%
Vancouver Mt Pleasant13%13%26%
Surrey Guildford17%9%26%
Chilliwack17%8%26%
Cariboo North20%5%26%
Kootenay West18%7%24%
Burnaby Deer Lake14%10%24%
Stikine19%5%24%
Surrey Newton15%9%23%
Burnaby Edmonds12%10%22%
Surrey Green Timbers14%8%21%
Surrey Whalley14%7%21%
Richmond South Centre11%10%21%
Peace South18%2%21%
Richmond North Centre10%10%20%
North Coast16%3%19%
Nechako Lakes9%4%12%
Total19.4%11%
(now 14%, as of Oct 23)
30%
(now 33%, Oct 23)
*numbers may not add up due to rounding. Riding-by-Riding not updated for Oct 23.

It appears the advance polls of Michelle Stilwell’s riding were more densely packed than a Fanny Bay oyster bed. Just to be clear, the voter turnout there is already over 45% and they haven’t even got to Election Day. I realize that many ‘experienced’ voters on the Island like to go to bed after the 5:30pm Chek 6 News, but I’m beginning to wonder if they voted early in order to sleep through the entire weekend.

It’s not just Parksville-Qualicum, 7 of 8 early bird ridings are on the Island. By God, democracy is alive and well over there. There are probably a few factors at play:

  • The Island has an older population compared to rest of BC, and it has been clearly shown that older people are more likely to vote.
  • The Island population is not particularly diverse. In ridings with high populations of non-English speakers, language can be a barrier to participation. In fact, highly diverse ridings like Richmond North Centre, Richmond South Centre, Surrey Newton, and Surrey-Green Timbers have among the lowest early bird totals.
  • The Greens are much stronger on the Island, which helps boost turnout due to increased competition.

(Bryan Breguet – Too Close Too Call website – did some interesting analysis here and here. He spent more time number crunching.)

Northern ridings Nechako Lakes and North Coast are the bottom two. They appear to be saving it for Election Day. Stikine and Skeena had higher advance turnouts but low mail participation.

The top advance poll riding was Boundary-Similkameen (29% of registered voters), though they weren’t as big on mail there. Oak Bay-Gordon Head was huge on mail (#1), and had a pretty solid advance poll too.

There is some correlation to high turnout ridings voting early, however, that is not uniform. I looked at turnout in 2017 and it is not straightforward correlation between overall turnout and early turnout. You can see from the table above that there is quite a bit of variation between advance and mail. Rural ridings have a different pattern than urban, the Island is different, etc.

Is there a pattern here? Does this signal a partisan advantage? Public polls breathlessly report that vote-by-mail and/or advance voters are leaning this or that way. If that is the case, and early voters are skewed differently than general election day voters, then that factor will be more at play in the top half of the list than the bottom. In other words, ridings with a higher percentage of votes yet to be cast are potentially more volatile.

What’s the big lesson? Early bird gets the worm? With an estimated half-million early bird votes to be counted after Election Day, I would say don’t count your chickens late November.

Who’s voted? Who knows?!

Elections BC has been providing daily updates about who has been voting and one thing is clear – it should be a lot easier to get a parking space at the polls on Election Day. More people will have voted early than ever before.

Let’s break it down.

Mail. In 2017, a grand total of 6,517 British Columbians voted by mail (0.3%). This time, there is a more than 100-fold increase, with an estimated 725,000 British Columbians requesting vote-by-mail packages, representing more than one-third of all votes cast in the last election. So far, 304,500 packages (42%) have been received by Elections BC with four days to go. Some who requested packages will decide to vote in person, or won’t vote … hard to say how many, yet.

Elections BC’s vote-by-mail advisor has been busy

Advance. In 2017, 617,175 voted in advance polls prior to election night. With the mail-in ballot, it was a question as to how many would show up to advance polls this time. So far, advance voting this time is almost on pace with 472,354 having voted in the first five days, which is about 96% of the 2017 pace of advance voting. There is also an extra day of advance voting this time, so there will actually be more advance votes in 2020 than 2017.

When you add up Mail and Advance, it makes you wonder who’s showing up on Election Day.

Almost two million people voted in 2017 (1,986,374, actually). If 80% of those vote-by-mail packages requested are returned, and advance voting exceeds the level of advance voting in 2017, then I estimate around 1.25 million British Columbians will have voted early. If the same number of people vote this time as 2017, that accounts for about 63% of all ballots cast, leaving only 37% to show up on Election Day and vote. In 2017, two-thirds (66%) of BC voters voted on Election Day.

The number of registered voters in BC has increased by about 7% since 2017 so it is reasonable to expect that more will vote in this election, despite the fact that people say no one is paying attention. (I would say that 725,000 vote-by-mail packages shows that many are paying attention). If the total number of voters increases, then maybe 40% to 50% of all voters will vote on Election Day, but still quite a bit lower than what we are used to.

GOTV. Or ‘Get out the Vote’ for the uninitiated. Campaigns can mark off the 600,000 or so voters that have already voted, but they can’t track who has requested a mail package other than asking people if they have already voted. Therefore, campaigns are chasing voters that may have already voted. Let’s do some rough math. 2 million people vote. 600,000+ vote in advance (30%) – done, cross them off. Around 600,000 vote by mail (30%) and 800,000 vote on E-Day (40%). Campaigns will have a challenge on focusing on the voters that haven’t already voted.

I pity the poor voters who voted by mail but will still be called relentlessly by the local campaign because they are not marked off on a bingo sheet.

Election Night results. What will we know and when will we know it? On Election Night, general voting day ballots and advance poll ballots (most of them) are counted that night. In 2017, an estimated 91% of all ballots were counted and reported on Election Night by bedtime. Even still, it was inconclusive, but that was a bit weird – usually, you know who has won by 9:15pm. This time, they will only count about 70% of the ballots on Election Night by my estimate. That number could be lower if (a) a higher % of people cast their ballots by mail, and (b) there is a lower than expected turnout on Election Day.

Let’s go with 70%. With 30% of the mail ballots outstanding, it will be very hard to call close election races. About 22 of the 87 ridings last time were settled by a margin of 10% or less.

When we will know? As I wrote earlier in the campaign, they don’t even start counting mail ballots until November 6th under normal circumstances. We do not have normal, here. Elections BC has to vet and verify all of the 600,000 plus packages. For example, they have to make sure people don’t vote by mail and vote in person.

They have to count these ballots by hand. They might need to borrow some of those contact tracers.

Once they open the packages, what a delight. Many of the early mail ballots were cast before nominations closed so people could write in their party name or expected candidate. There will be illegible handwriting, spelling errors, and other issues to interpret.

Here’s a brainteaser. In the riding of Richmond-Steveston, there is no Green Party candidate, but the the NDP candidate’s last name is Greene. If someone writes “Green”, what do they mean? I assume Green Party, if there is no ‘e’ on the end, but I can hear the galloping hoofs of lawyer-laden wagons heading to the cannery district already.

The counting of the mail ballots may not start until mid-November or even the third week (one estimate was November 21st). Then they have to count them.

Through all of this time, government is in caretaker mode. This means they can’t do much other than really important stuff that comes up and has to be dealt with. There won’t be a new cabinet until election writs are returned.

The Waiting Game. The worst hour for campaigners is 7:45pm and 8:45pm on election nights when you’ve done pretty much all you can do, but the results haven’t started to flow yet. Imagine having to wait from 7:45pm on Election Night, October 24th, to American Thanksgiving.

For most of the ridings, yeah, they will know. The top of the top NDP ridings and the top of the top BC Liberal ridings will be confirmed that night. You can check out top ridings from last time here.

But where will be the close ones? There will be two variables in play- how close is the race and how many people voted by mail?

Some ridings have seen less than 10% of registered voters request packages while in other ridings it’s over 30%. Province-wide, 21% of registered voters have requested a package.

I don’t know what’s happening on Vancouver Island. As of Monday, almost 2 in 5 registered voters in Oak Bay-Gordon Head and Victoria-Beacon Hill have requested vote-by-mail packages – 38% to be exact. They seem pretty keen to vote over there.

Vote-by-mail has not taken off in many rural ridings. Perhaps voting in person is just the way it oughta be done. Some might say those city slickers can’t be bothered to stretch on their Lululemon pants and take their e-scooter to the poll located in their strata complex, but, by golly, BC’s rural residents will drive three hours through blinding snowstorms to exercise their democratic rights. (I own Lululemon pants, I wouldn’t say that.) Regardless, only 6% of registered voters in North Coast, 8% in Skeena, 9% in Stikine, and 9% in Fraser-Nicola have requested mail packages.

The suspense-filled seat of Courtenay-Comox has had over 12,134 registered voters request packages (26%). That seat was settled by a margin of 189 votes in 2017. Likewise, other 2017 ‘close calls’ have lots of outstanding mail this time: Vancouver-False Creek (13,365), Coquitlam-Burke Mountain (9,572), and Surrey-Panorama (8,130), for example.

Many candidates will simply have to wait it out. They could go to Hawaii for two weeks, quarantine back home for two weeks, and still not know!

More agony. Oh, this is the worst. You know the story about the candidate who is declared elected, but actually lost? (Sorry, Frank). Happens a lot. There are going to be cases of candidates with nice leads on Election Night that see them evaporate when the mail ballots are counted. I don’t know if the mail ballots will be skewed toward the NDP, BC Libs, or Greens relative to Election Night results. Who knows? But what will happen is the poor candidate who has a 127 vote lead has to wait a month to have another 10,000 votes counted. This is, frankly, how you could torture someone as an alternative to waterboarding. A bunch of well-meaning dopes are going to say to them, “Oh, it’s going to be alright. I’m sure you’ll win.” Or gloomy types will wear their anxiety on their sleeves and exist in a waking state of misery. My advice for candidates in a state of suspension – binge watch Netflix and let your team worry about it. Might help.

An election in a pandemic. It’s been a strange one. And it ain’t gonna be over for awhile. You can mail that one in.

BC Election: How the ridings stack up

Someone’s job on the campaign is to count. You need 44 seats for a majority government, 45 to govern without deadlock, 46 to breathe easier.

In an 87 seat Legislature, getting to 44 is really hard. Last election, the BC Liberals hit the wall at 43, the NDP were stopped at 41, but catapulted to 44 thanks to their erstwhile partners, the Greens.

To get to 44, you obviously look at the battleground – those ridings that were decided by slim margins last time, or for some reason, are ‘in play’ this time – maybe because of the candidate mix or due to the way the issues are playing out.

In 2001, the BC Liberals won 77 out of 79 seats. Victoria-Beacon Hill and Victoria-Hillside where the last two to come in, during the recount. Though they elected BC Liberals, they were the 76th and 77th best seats. By 2005, those seats were underwater and they remain top 5 NDP seats today. The point is that the overall number of seats won will mostly follow the ‘depth chart’. Win 52 seats and your 52nd best seat becomes a win. The votes have to go somewhere.

The following table looks at 84 of the 87 seats that elected either an NDP member (orange) or a BC Liberal (blue). This is the main stage.

The table is sorted by NDP strength. The #1 riding (Mt. Pleasant) is where they had the largest vote percentage gap versus the BC Liberals. The weakest NDP riding was Peace North. Where the 41st best NDP riding (Courtenay-Comox) and 42nd best NDP riding (Coquitlam-Burke Mountain) meet up was the dividing line between winning and losing in 2017.

You can see each riding’s rank in 2013 and 2017 side-by-side. Some ridings moved up the NDP depth chart, and others fell. The difference is noted in the far-right column.

(** There was a boundary redistribution between 2013 and 2017. Therefore, the 2013 ridings are actually the 2017 boundaries with results from 2013 transposed. That’s why Surrey-Fleetwood reports as an NDP riding (2013) when in fact the BC Liberals won. All things being equal, Peter Fassbender would have lost in 2013 had he run on those boundaries. He won in a nail biter and, to his credit, he agreed to run again in the Fleetwood seat when he knew it would be tough.)

Ten of the twelve closest seats that elected NDP MLAs in 2017 flipped from the BC Liberals. This is not uncommon – how else are you going to gain seats? It does illustrate the battleground. Nine of ten of these NDP wins were in the Lower Mainland. The BC Liberals flipped two NDP seats – Skeena and Columbia River-Revelstoke – both in the Interior.

While the popular vote was essentially tied between the two parties, the Lower Mainland turned against the BC Liberals while the Interior turned further against the NDP. Unfortunately for BC Liberals, there are a lot more seats in the Lower Mainland. The Island’s impact was felt with Courtenay-Comox and the election of three Greens.

When you look at the far-right column, you will see how some ridings changed on the depth chart. Nine ridings moved more than 10 spots ‘up’ the NDP rankings. They included three of the Richmond ridings, three South Surrey ridings, Langley, Pt. Grey, and New West. The NDP only won 2 of 9 of these seats, but, this time, the NDP sees Richmond, Langley, and Cloverdale as a battleground.

On the BC Liberal side of things, ten ridings moved up its depth chart – all in the Interior.

Overall, just over half of the seats in this table stayed within plus or minus five spots from the 2013 results, and, three-quarters stayed within ten spots. Nineteen seats, listed above, had the most volatility – less than a quarter of all seats.

Some seats evolve over time. Vancouver Pt. Grey was BC Liberal from 1996 to 2013, but now appears firmly in the column Mr. Eby and the NDP. The NDP used to win Prince George, but now, it appears to be solid BC Liberal turf. These trends reflect the changing nature of electoral coalitions The NDP have given up support in the Interior in successive elections, in part due to positions on natural resources, but was more than offset by the BC Liberals weakness in the most urban ridings in 2013 that extended to the suburbs in 2017.

This election, it’s clear from this table which seats the NDP and the BC Liberals have circled to get to 44 and above. On a separate list, there is the much smaller Green battleground.

What makes the task challenging for the NDP is that the lowest hanging fruit in the Lower Mainland are seats they have seldom won and, until recently, were not competitive. For the BC Liberals, their target seats are those that they held up until 2017.

We will see in late November, when all the mail-in ballots have finally been counted, which ridings follow the depth chart, which ones are the exceptions, and where the dividing line will be drawn.

BC election results by Thanksgiving… American Thanksgiving

Hurry up and wait. The election was called in a hurry but it seems we will all be waiting for the results.

It is becoming increasingly apparent that the results of the BC election will be incomplete on October 24th and, due to Elections BC processes, it may take another month or more before we know the final outcome.

Why? So far, over 430,000 mail ballots have been requested with an estimated 800,000 expected. Elections BC updates the number every day. (You can request a mail-in ballot from Elections BC here)

Google, er, Vaughn, how many ballots were cast last time?

From 6,600 to maybe 800,000 ! That’s approaching 40% of the amount of British Columbians expected to vote (2 million voted last time).

Hey Vaughn, why does the counting take so long?

As Vaughn notes above, all of the mail-in ballots have to be verified and vetted after Election Day to make sure people don’t vote by mail and vote at a polling station, they must verify that they are legitimate ballots, and the packages also must be sorted into 87 piles so that they are counted in the correct ridings.

Normally, the Final Count begins on the 13th day after Election Day (November 6th) but it may take longer to verify and vet the ballots.

How long, Vaughn?

If that is the case, they may not start counting the ballots until almost four weeks after Election Day. Then they have to manually count upwards of 800,000 ballots. It’s not like they haven’t done that before – they did it in 2018 with regard to the ProRep referendum, but it does take time. Plus, you can expect way more challenges of ballots since thousands of ballots are being cast without even knowing who the candidates are. The intention of the voter must be clear. In close races, lawyers and scrutineers for the main parties will be buzzing around like hornets.

What does this mean for Election Night? On October 24th, after the polls close at 8pm, all of the ballots from Election Day and advance polls are counted. In 2017, over 90% of all ballots were counted on Election Night (the remainder were counted at the Final Count). About 61% of British Columbians voted on Election Day, while about 30% voted in the advance polls.

In 2017, Courtenay-Comox was so close on Election Night that the remaining ballots did make the difference. Usually, there are a few ridings that go down to the wire, but it’s not often that the verdict of the entire election hangs on it, like it did last time.

This time, instead of 91% of the votes being counted on Election Night, far fewer – maybe as low as 50-60% – will be counted making the final outcome uncertain in a lot of ridings.

As I noted in an earlier post, twenty-two ridings were settled by a margin of 10% or less in 2017. You could have about as many or maybe more hanging in the balance for a month, maybe more, while the votes are counted.

Therefore, there is going to be a weird interregnum between October 24th and sometime in mid-late November (early December?) where we do not know the final outcome of the campaign. Premier John Horgan and his cabinet (including the retiring cabinet ministers like Carole James, Shane Simpson and Claire Trevena) will continue to govern in ‘caretaker mode’ until this is settled conclusively.

It will be torture for those candidates in the battleground seats. There won’t be any doubt in ‘safe’ seats, but there will be some candidates who lead on Election Night and lose in the Final Count, and vice versa. The waiting is the absolute worst.

Ironically, we may know the final outcome of the hotly-contested US presidency by American Thanksgiving but still be wondering which leader gets to carve up the turkey in British Columbia.

We all may need a drink when this is over

Vaughn, when do you think we will know? Vaughn…? Vaughn… ?

Free enterprise has been tough to beat in BC elections

Free enterprise coalitions usually win in BC. Electing a left-wing government has proven very hard over the last 80 years.

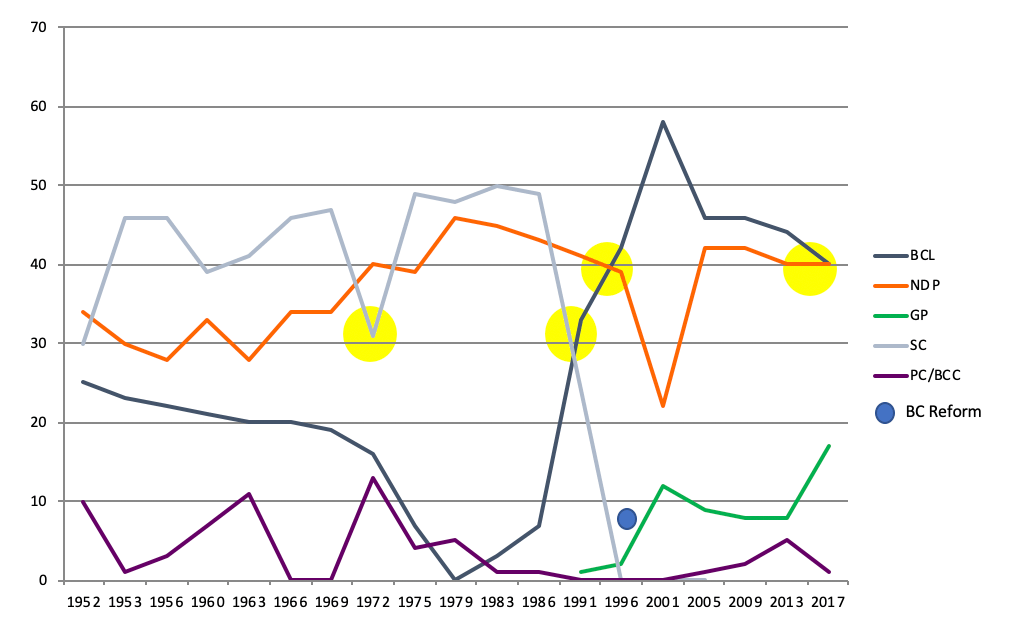
Since 1941, when the Liberals and Conservatives formed a war-time coalition to govern, it’s largely been a question of the NDP (and its predecessor, the CCF) contending against the leading free enterprise party or coalition in a bruising, polarizing battle. The scorecard is: Free Enterprise 17, CCF/NDP 4.*

Starting in 1952, the new de facto coalition was the Social Credit Party when it emerged from a four-way race to gain power and hold it for 20 years under the premiership of W.A.C. Bennett. In 1991, after winning 11 of 12 elections, the Socreds were dealt a mortal blow and were, subsequently, eclipsed by the BC Liberals who would evolve into the modern-day free enterprise contender. In this transitional period in the 1990s, the NDP won back-to-back majority governments.

The yellow circles note the times that the NDP won elections (1972, 1991, 1996) or took power (2017). In the first three, there was a significant vote split on the centre-right:

  • 1972: an uptick of BC Conservatives eroded Socred support. The Socreds won in 1975 by remaking its coalition, jumping from 31% to 49% of the popular vote, defeating Dave Barrett’s NDP which basically held its 1972 vote at around 39-40%.
  • 1991: the demise of the Socreds and simultaneous rise of the BC Liberals created a vote split that helped Mike Harcourt’s NDP win a majority.
  • 1996: the upstart BC Reform Party cut into BC Liberal support, helping Glen Clark’s NDP win a majority, despite losing the popular vote.
  • 2017: this was the first time the NDP gained power in BC without a significant centre-right vote-split across the province. While some BC Liberal voters (especially in Metro Vancouver) migrated to the Greens as the only alternative to the NDP, it was a single BC Conservative candidate in Courtenay-Comox that struck the decisive blow, taking over 7.5% in a riding the NDP won by only 189 votes.

When the NDP wins, it has some help, and sometimes that help is because of a tired government on its last legs. NDP ascension to power in 1972, 1991, and 2017 came after spending prolonged stretches as Official Opposition.

John Horgan is trying to make history in this election by being the first sitting NDP premier to serve a term of government and win a majority government. He enters the election enjoying high poll standings unfamiliar to his predecessors, and hopes to win BC Liberal votes outright rather than relying on a vote split. By winning a plurality of the popular vote and winning a majority of seats, it would be a historic win for the NDP, given the historical scorecard.

From the BC Liberal standpoint, it has entered an election as main contender in the six past elections, having won a majority four times, and winning the popular vote the other two times (when it did not ultimately form a government). It has been a successful big-tent free enterprise party in the modern era.

The question now is: Can the NDP sustain its pre-election lead in the polls? Alternatively, can the BC Liberals galvanize supporters and consolidate the free enterprise vote as it has done since 1996? Other than the 2001 election, every election in the past 50 years has been a hard-fought battle where the outcome was never entirely certain at the outset of the campaign. We are used to tough fights and a simple cruise to victory would go against the grain of BC politics.

*Scorecard: Free enterprise 1945, 1949, 1952, 1953, 1956, 1960, 1963, 1966, 1969, 1975, 1979, 1983, 1986, 2001, 2005, 2009, 2013; CCF/NDP 1972, 1991, 1996, 2017 (gained power)

BC political histories on rosedeer.blog: