The Grey March

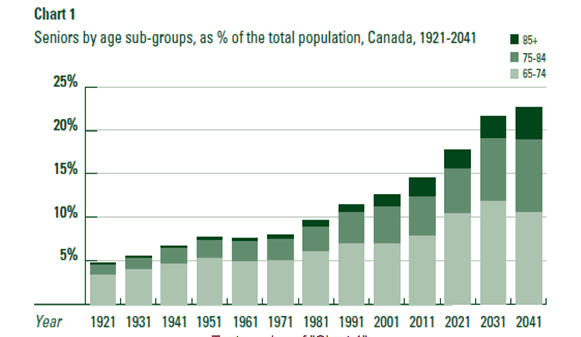
Canada’s legion of Grey voters are growing and are a bigger slice of the pie with each passing election.  We saw in the Lower Mainland transit referendum that voting is a contact sport for grandma and grandpa.

Screen Shot 2015-09-30 at 8.43.05 AM

Two polls released earlier this week show that a Grey March may be afoot.

Abacus:

60 years plus:

  • 41% CPC
  • 26% NDP
  • 24% LIB

IPSOS:

55 years plus:

  • 41% CPC
  • 26% LIB
  • 25% NDP

In both cases, older voters are returning to the Conservatives.  We all know old people vote at a higher rate, so … election in the bag?  Not so fast.

The Abacus poll shows the Liberals neck and neck with the Conservatives in the 30-59 age group (NDP close behind), while IPSOS shows a considerable Liberal lead in the 35-54 group.

IPSOS has the Conservatives lagging in the 18-34s (which rings true) while Abacus has a 3-way split in the 18-29s (that would be surprising).

Where were seniors and soon-to-be seniors a few weeks ago?

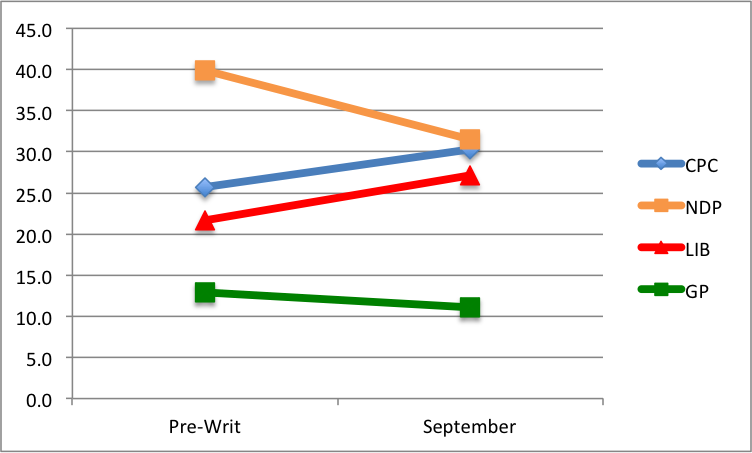
Among 60 plus, Abacus found a 7 pt Conservative lead over the Liberals between September 9th -11th; they’ve stretched that lead to 15 points over NDP and 17 points over the Liberals.

IPSOS had the Conservatives and NDP tied among 55+ (33% each) between September 4th -8th.  Now it’s a 16 pt Conservative lead.  That’s a huge swing.

Part of the story of the BC election surprise was the underlying turnout advantage of the BC Liberals.  The age demographic numbers seem familiar in this election except that it’s a three-way fight and the Conservatives do not have enough of a lead among older voters to compensate for weakness among younger voters.

Looking at the Abacus data, and crunching it against the overall number of voters in each age group multiplied by Elections Canada turnout estimates by age group, I find that the Conservatives have an extra bump of 1.5%, pushing them to 33.5% from 32%.  Compared to a few weeks ago, the Conservative war room is probably feeling pretty good about things.   Better not get too cocky about it though.  This race is still very competitive and they haven’t reached Joe Clark territory yet (35.9%).

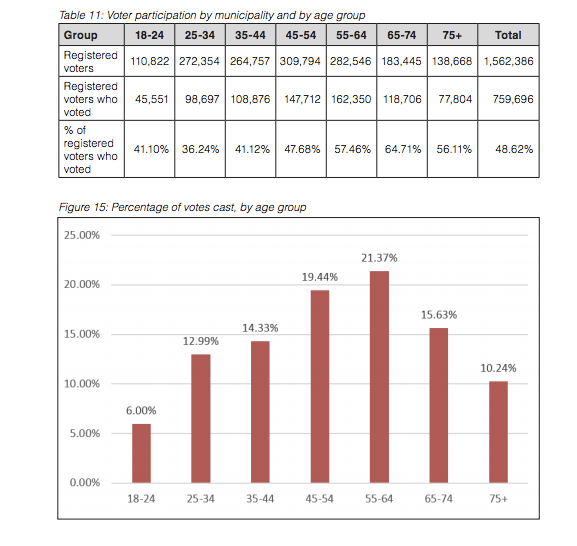
To win, the Liberals and the NDP need to slow down the Grey March.  These Freedom 55 voters have a turnout rate of around 70%.

Let’s climb down from this scenario and exhale.  Nineteen days is a lot of time in a campaign and we have seen what the last nineteen days have done to the NDP.  Anything can happen and there are things opposition parties can do to divert the march.  Moreover, this analysis is putting a lot of stock into two polls – there are countless others.

Looking ahead, three dynamics on the Grey March:

  1. At 41% among the Grey, the Conservatives are still well below the level of support they had in the last election among this group.  Arresting Conservative growth will thwart their ability to have a decisive win.  Turning it back, will result in a change in government.
  2. What’s the message for seniors?  The Conservatives are dropping messages into this category with precision and it appears to be working.   Opposition advertising will need to be revisited.  Will Justin be able to polarize the debate to drive NDP seniors over to Liberal? Or is at matter of Justin appealing to small ‘l’ liberal seniors who are parking with the Conservatives until they decide on Justin’s readiness?  The NDP have had a stronger appeal with seniors leading into the election than the Liberals but are seeing it ebb away.  Seniors remain consumers of newspapers and TV news – wooing them is not a social media campaign.
  3. In so much as there is a generational advantage with younger voters, effective turnout strategies will be critical.  In other words, if you are going to lose with seniors, you better turn out younger voters.  A very hard thing to do and, in the context of limited resources, arguably yields a poor return.  It would be better to just not lose with seniors!

Did I say there were 19 days left in the campaign?  Oops.  An increasing amount of voters are utilizing advance polls, with seniors being the keenest to vote early.  This election will be over for many voters well before the 19th.

Keep an eye on the Grey March.  The age breaks in these surveys should be focusing the minds of all campaigns and serve as a wake-up call to opposition parties about where this election could be headed.  They’ve fallen … but they still have time to get up.

Power Point Polling Palooza with Professor Greg Lyle

I started off the week with a Monday am breakfast presentation of poll numbers from Greg Lyle of Innovative Research Group.  No doubt, all Canadians will be dining out on poll numbers for the next three weeks.  We’ll be stuffed like Thanksgiving turkey.

I worked with Greg on two occasions: with the BC Liberals from 1994-1996 where we triumphed by winning the popular vote, and from 2005-2010 when I was an associate with Innovative.  As I have grown accustomed, Greg – or ‘Professor Lyle’ if you will – came loaded with a blizzard of line graphs, stacked columns, and pie charts.  It was Power Point Palooza.  Political geeks like me go to these breakfasts instead of Burning Man.

You can’t walk down the street without running into a pollster these days.  But few pollsters dig into the numbers like Greg and share those insights with the public. Sure, you can get some version of the horserace on your next newscast, but Greg is asking – as the horses are in the 5th of 8 furlongs – what are the track conditions?  What are they feeding the horses?  What is the performance of the jockey?  Does the horse have the stamina to finish?  Should the horse be sent to the glue factory?  I’ve had a lot of ‘winning bets’ in the fifth furlong only to see my horse fade down the stretch.  Greg is focused on why the voters are responding the way they do.  That’s interesting stuff.

Here are three slides from his presentation and why they matter:

  1.  The Liberal – NDP Primary

Is this a general election yet, or just a primary between the Liberals and the NDP as to which will be in the runoff with the Conservatives?  Greg asks who’s made up their mind versus who would like to hear more.

Mind made up

Only 26% of Conservatives would like to hear more while 42% of Liberals and 43% of NDP are open, not to mention 44% of the Bloc and 50% of the Greens.  As a succession of recent polls show (Nanos, Abacus, Innovative), the NDP are struggling to stay with the Liberals, in part because they are shedding support in Quebec and slipping behind in Ontario.  The key to 24 Sussex Drive for either Justin Trudeau or Thomas Mulcair is to win the primary and the research shows minds are still open.  However, it’s not a closed primary.  Some of those votes are open to the Conservatives too.

             2.  The shifting support among values clusters

Greg’s research shows party support by values clusters measured on a two-dimensional scale: by left-right axis and a populism axis.  Populism is measured (my colloquial explanation) by whether one defers to experts or one puts more stock in the common sense of regular people.  You might say it’s Starbucks vs. Tim Horton’s.

values

What Greg found is that, since July,  the Liberals have been poaching the most support from the NDP among Core Left  and Left Liberals.  Liberals have also gained from the Conservatives among Business Liberals (centrist, non-populist – think Paul Martin) while the Conservatives have gained support from Liberals among Deferential Conservatives (conservative, non-populist – think Joe Clark).

Here are the numbers for these clusters:

Cluster July NDP Sept NDP July LIB Sept LIB July CPC Sept CPC
Core Left 59% 41% 28% 35% 3% 6%
Left Liberals 38% 27% 29% 40% 14% 16%
Business Liberals 23% 21% 30% 37% 30% 26%
Deferential Conservatives 16% 15% 22% 15% 52% 58%

Thus, you have some voters returning to natural homes, but you also have some lefties migrating to the Liberals too.

Interestingly, it is the non-populist voters that are the most volatile, according to Greg’s research, while the populist voters have not moved as much.    I expected the opposite to be true, but an explanation may be that populists have decided and moved on and “the Starbucks crowd” are debating their vote before they make it.

With regard to the ‘primary’ discussed in my first point, there is movement among NDP and Liberal voters, but there is a flow from Liberal and NDP to Conservative too.  The Conservative growth potential is not very high, but they only need a few points to make a huge difference.  One populist cluster that did show some movement was Populist Conservatives which saw a swing of 7-8 points from the NDP to the Conservatives (think Vancouver Island loggers or Kootenay miners as an example of a Populist Conservative).

See the full value clusters deck which includes how each values cluster is constructed and defined.

             3.  The Consistent versus the Ambivalent

I am highly interested in who is actually going to vote.  As I posted recently on the Lower Mainland transit plebiscite, there is usually a strong age correlation that peaks in the 65-74 age group.  Greg’s research offers an insightful analysis based on consistency versus ambivalence.

Essentially, he has analyzed the answers of individual respondents within the survey and categorized people based on who is consistent on responses, who is conflicted, and to what degree they are wishy-washy (eg. respond ‘don’t know’ to a lot of questions, undecided on vote).

Ambivalence


About a quarter of those polled are perfectly consistent and likely have a plan to vote.  About 13% are, well, out-to-lunch and will likely not vote (in my opinion).  That leaves about 60% of voters who are on a continuum of mainly consistent to mainly ambivalent, and within that continuum, they are the ones that are more likely to say they would like to hear more.

Ambiv 2

In the consistent-conflicted range, “would like to hear more” ranges from 45%-65%.  This reflects a lot of the Lib-NDP switchers.

But my starting point on this topic is who is going to vote?  Perhaps Greg will show these consistency segments by vote as whoever has the most ‘consistent’ supporters compared to ‘ambivalent’ supporters will have a turnout advantage.

In any event, analyzing survey responses to design such a segmentation is pretty cool.


In conclusion, a lot of polling is being digested in this election.  It’s good to see work that goes deep and is publicly available.  This is different than what political parties are likely doing internally, but if you’re in the peanut gallery, and you’re watching a horserace, then you can dig into it while mixing your metaphors, and see how it all turns out on October 19th.


Election turnout: Will cranky old “won’t says” deliver an October surprise?

Cranky old geezers.  You know who I’m talking about.  They get a phone call at dinner time and damn well won’t say how they voted – “Won’t says”.

In a live telephone survey (humans talking to humans), there is always a percentage of respondents that will take the survey, but won’t play ball on the political questions.  Partly it’s a matter of principle that it’s a secret ballot and their own business, no one else’s.  Partly they got up on the wrong side of the bed.

My review of some recent telephone surveys indicates about 6% or 7% of respondents will refuse to answer the ballot question.  When I looked further, it was disproportionately older voters who refused, and in one survey, they expressed a high likelihood to vote relative to other respondents.

Thus, that 6% to 7% of refusals might actually represent 8% or 9% of the electorate – the people who actually vote.

(Nanos Research is doing live telephone tracking but it is not releasing its cross tabs or won’t says)

Won’t says don’t really appear that much in online surveys because people that belong to online panels want to share their opinions proactively.

My assumption regarding automated IVR surveys is that those not wishing to play ball with the survey hang up and the refusal is not recorded in the topline.

Based on the live telephone surveys we at least now that, say, 1 in 12 voters are uncooperative in sharing their opinion so that creates the potential for a skew of results.  Not a huge skew, but a bit of a skew.

Let’s say Party X has 30% support in the polls and that’s actually how it plays out.  The 92% of cooperative sample brings 30% of 92% to the voting stations  Then let’s say Party X has 45% support among the 8% of won’t say voters.  Combine that and their vote rises from 30% to 31.2%.  Meanwhile, Party Y also gets 30% among the 92%, if you follow.  But in the 8% won’t say pool, Party Y only yields 20%.  Their overall result drops from 30% to 29.2%.

 (92% of voters) Cooperators % of votes cast
Party X 30.0% 27.6%
Party Y 30.0% 27.6%
 (8% of voters) Won’t Says % of votes cast
Party X 45.0% 3.6%
Party Y 20.0% 1.6%
Final total Change
Party X 31.2% plus 1.2%
Party Y 29.2% minus 0.8%

Therefore, if the won’t says break hard to one party, in this scenario they would cause a two-point differential in the polls, which would be very significant in a close race.  The support was always there, it was just under-reported.

There are other factors that make it difficult to transfer polling results to election returns, which I will write about later, but the issue of won’t says is one that there isn’t a lot of discussion about and may contribute, in part, why we see election night surprises.

Those cranky old won’t says do deliver an important message – they’ll vote any way they please, pollsters be damned.

Over 50% shades of grey in Transit vote turnout

Elections BC released voting information from the transit referendum, er, plebiscite.

The published turnout rate ranges from a low of 36.24% among 25-34 year olds to 64.71% among 65-74 year olds.  This is consistent with the 2013 provincial election in terms of older people voting at a higher rate than younger people.

Why are 18-24s voting at a higher rate than 25-34s?  They’re not.  Turnout rate is based on % of registered voters but fewer 18-24s are registered to vote.  Base it on actual population and you will see a lower number.  Turnout typically peaks at 65-74 age then declines post 75, though still high relative to under 50 crowd.

Screen Shot 2015-09-22 at 4.15.26 PM

It’s interesting to see the share of voters from each age group – this is more important.  Over 47% of the transit vote was over age of 55.  They are punching above their census weight while the opposite is true of younger voters.  About one-third of voters were under age of 44.

Bear this in mind when reading the polls.  Parties or candidates with high support in 18-34s may not sustain that support on Election Day while parties with strong support among plus 55s can surprise.  Where have I heard that before?

What happened to the NDP vote?

The persistent media narrative has been that the NDP have a big lead in BC in #elxn42.  Or do they?

Nanos tracking has show a decided downward trend for the NDP in the past two weeks.  While it is has now appeared to stabilize – they were third at one point – they are no higher than the Conservatives.  If the polling is accurate, it’s not great news either for the Conservatives who are far below their 2011 mark but better than the pre-writ.  It’s a lot better news for the Liberals who have bounced back from a lousy spring-summer.

Last week’s release of polling data by the Dogwood Initiative is interesting on two counts.  First, the numbers in and of themselves show that in seven ridings, the NDP vote was down across the board.  The average decline in NDP vote from pre-writ to September was -8.4% of the decided vote per riding.  Conservatives up an average of 4.6% and Liberals 5.5%.  That’s a 14 point swing between NDP and Liberals and 13 for NDP/Conservative.  While the earlier Dogwood polling was trumpeted by the left-wing organs, not much heard on this round.

This not-too fancy graph shows the results across seven “battleground” ridings tested by Dogwood and Insights West: three on the North Shore (West Van, North Van, Burnaby-NV Seymour), South Okanagan-West Kootenay, Vancouver South and two on the Island (Courtenay-Alberni and Esquimalt-Saanich-Sooke).

Dogwood polls

In the weeds, here are the swings in decided vote per riding.  That’s a pretty big swing in Burnaby-North Van Seymour, changing the story from a 27 point NDP lead in May to a four-point lead in September.

CPC/NDP swing LIB/NDP swing
West Van – SC – Sea to Sky(J) -4.6 -7.0
North Vancouver(J) -11.4 -20.3
Burnaby-NV Seymour(M) -22.7 -22.9
Vancouver South(J) -11.5 -9.5
South Okanagan-W.Kootenay(J) -20.9 -19.5
Courtenay-Alberni(M) -5.1 -1.9
Esquimalt-Saanich-Sooke(M) -15.1 -16.3

This is more interesting if you take the polling literally, and I don’t.  I don’t think the first round of polling was realistic.  They had the Liberals at 6% in Burnaby-North Van Seymour.  Give me a break.  However, given that some media reported these numbers on the first go-around, they are obligated to give the second round some attention as well, and if they do, they must show that the NDP have fallen from great heights.  The Notley-Alberta win halo effect is wearing off.

Which brings me to my second point.  Why is Dogwood doing this in the first place?  They are presumably doing this to encourage strategic voting.  Well, the results show that the Liberals are rivalling the Conservatives in areas where Liberals have won seats before, and NDP are doing well in other seats where they are traditionally stronger.  Surprise, surprise.  Is this polling necessary?

The party that is not being helped by Dogwood on any of this is the Greens, the party that truly supports Dogwood’s anti-pipeline stance.  After all, the NDP position on Kinder Morgan is nuanced, to say the least.  The Notley government in Alberta will go full-out to lobby a federal NDP government to approve a pipeline to the west coast.  But the Greens have been written off by the strategic voting advocates using the logic of don’t vote for who you want, vote for who has best chance to beat Harper.  Elizabeth May would not have polled very strongly five weeks out in 2011 either but she won.   How about letting people make up their own mind – they will anyway – and they often do so in pundit/pollster-defying ways.

If I were in the war room for the NDP or Liberals, I would want to tell Dogwood to take a hike with their polling.  I would want to duke it out on my own terms.  If I were in the Green war room (if they have one), I would be thinking “with friends like these, who needs enemies”.

Facing down BC history in #elxn42

Every day, we are bombarded by polls and seat forecasts that tell us how we are going to vote, even if “we” haven’t made up our mind. In BC, there are three patterns that have defined our voting over the years and the party that breaks the mold this time may hold the key to forming government.

  1. When we get mad at Ottawa, we don’t forget easily

BC fell in love with Pierre Trudeau in 1968 and sent 16 of 23 Liberals to Ottawa.  Trudeaumania was not as deeply felt in the rest of Canada as it was here – BC embraced it.  The bloom was soon off the red rose and by the late 1970s, western alienation was in full swing. Memories of the middle finger in Salmon Arm, the collapse of the economy in Western Canada, and other crimes, real or imagined, led to a lost generation for Liberals in BC.  The same can be said for the Progressive Conservatives.  BC had its first homegrown prime minister in 1993 when Rt. Hon. Kim Campbell took the reins, but she was carrying the baggage of the deeply unpopular Mulroney government that had alienated BC over constitutional issues, perceived regional favouritism, and the imposition of the GST. The soiled PC brand was wiped off the political map.  Harper’s plurality in BC today is a direct descendent of Preston Manning’s Reform movement built on western rage.

  1. When we remember BC NDP governments, we don’t vote NDP.

As memories fade of past NDP governments, support rises.  The NDP were hammered in 1974 during the Dave Barrett government.  They lost in strongholds like Port Alberni, Prince Rupert, and East Vancouver. The NDP regained support federally in 1979 and were the #1 or #2 party until 1993 when they collapsed again in their core areas.  The 1993, 1997, and 2000 elections took place amidst the NDP’s decade of power from 1991-2001.  Due to a very unpopular provincial NDP government, the federal slate was reduced to a rump group. Since 2003, they have been gathering strength federally.

  1. We’re supposedly a small ‘l’ liberal province, but we usually don’t vote for the federal Liberals.

BC is regarded as the California of Canada. Marijuana dispensaries more numerous than Tim Hortons’, craft beer flowing in the streets, strong environmental values, and permissive attitudes on social issues – shouldn’t BC be a bastion of Big-L Liberal support?

Actually, the values change when you cross Boundary Road and definitely when you go beyond Hope. There are also key values differences in BC’s emerging multicultural communities. Liberals over the years have mainly been fenced into a mainly academically oriented, income-enriched enclaves in, and near, Vancouver and, occasionally, Victoria.   Voters in the suburbs and resource communities have looked primarily to the Conservatives and alternatively to the NDP in recent elections. Middle of the road fuzziness has lost out in the rough and tumble of BC’s polarized political climate.

How do these factors stack up for the parties today:

  • Justin Trudeau’s job is to break out of the urban core and alter a generation of voting patterns. Like his father, he has an unconventional appeal and represents a fresh opportunity compared to the failed campaigns of Stephane Dion and Michael Ignatieff. His challenge is to have his message resonate in the suburbs, sounding less like an ivory-tower liberal and more like Main Street. Strong retail Liberal candidates like Sukh Dhaliwal in Surrey have bucked the trend in the past, but he’s been an exception.
  • Thomas Mulcair benefits from having as much distance from previous NDP governments as possible, however, he may be haunted by failed NDP elections in BC where they were unable to be clear about balancing the economy and the environment. His job is to keep the Liberals fenced off, and drive voter anger about the Conservatives, hoping voters have a slow burn over the next five weeks.
  • Stephen Harper faces a tougher BC scenario than any election he has led since 2004. Simultaneously demonizing the Liberals and NDP will be taller orders this time, while he faces a version of voter anger directed at him. He will likely now double-down on direct appeals to business-oriented voters and to populist voters that do not take their direction from media and political elites. The prime minister of Canada will run an, ironically, anti-establishment campaign in BC.

This election, BC is truly a key battleground that could determine the outcome on Election night. The future government may be decided who best conquers historical forces.