Liberal pathways to victory

If the Big Red Machine rolls to victory on October 21st, how will it be done? Regional seat balances have been like whack-a-mole this election.  In this post, I look at examples of Liberal wins, and the regional coalitions they were based on, since the 1960s – and which of these scenarios Justin Trudeau’s Liberals might emulate this time.  (See my recent post on Conservative pathways to power).

Will it be:

  • Lester Pearson’s near miss in 1965
  • Pierre Trudeau’s close shave in 1972
  • Pierre Trudeau’s Central Canadian Special in 1980
  • Jean Chrétien’s ‘Ontario, baby!’ win in 1997 (a model he used three times), or
  • Paul Martin’s missing majority in 2004
  • Or a repeat of the all-in majority of 2015?

Pearson 1965: the near miss

Lester_Pearson_1957.jpg

He loved baseball but couldn’t hit the home run in 1965

Lester Pearson won a minority in 1963, defeating John Diefenbaker’s minority government that was elected in 1962.  The 1965 campaign was their fourth battle and Diefenbaker seemed out of gas.  Pearson recruited three star candidates in Québec by the names of Pelletier, Marchand, and Trudeau.  Despite boosting support there, Diefenbaker stubbornly clung to support in the rest of Canada (ROC), and rolled back Liberal support to some extent in the west and Atlantic Canada.  The math came up a little short with Pearson winning 49% of the seats (131 of 265).  Tommy Douglas’s NDP held the balance of power along with the Social Credit/ Créditistes.  Pearson won almost three-quarters of Québec, a majority in Ontario, but did poorly in the West.

Won big in Quebec, majority in Ontario, but lost badly in the west

PET’s close shave in 1972

Screen Shot 2019-10-12 at 2.02.07 PM.png

Land was Strong, but campaign wasn’t

Pierre Trudeau’s first win was in the height of Trudeaumania in 1968.  He won two-thirds of the seats in B.C. along with a strong showing in Central Canada.  By getting more out of the west, he had done what Pearson couldn’t do – win a majority.

The mood soured by 1972.  In the rematch with Progressive Conservative leader Robert Stanfield, Trudeau’s Liberals were very much on the back foot, and reduced to 38% of the vote and 109 seats in a Parliament of 265 members.  The Liberals sunk below thresholds that Pearson had won with in 1965, scraping by with a two-seat margin over the PC’s because of its strength in Québec where they won over half of their seats (56).

Won big in Québec, lost majority in Ontario and Atlantic, lost badly in the west

PET’s Central Canadian Special in 1980

Screen Shot 2019-10-12 at 2.20.33 PM.pngIn his fifth and final election campaign, Pierre Trudeau drove the Central Canadian Special right down the gut of Canada’s electoral map, winning a majority with 147 of 282 seats (52%).  He took 99% of the seats in Québec and a majority of seats (55%) in Ontario.  He had a little help from the Atlantic too, where  he had a better result (59%) than the previous two examples.  In the west, the Liberals were virtually extinguished, winning two seats in Manitoba.  Nuttin’ in BC, Alberta, or Saskatchewan.  Blanked in the North as well.

Dominated Québec, majorities Ontario and Atlantic, nowhere in the west

Jean Chrétien’s ‘Ontario, baby!’ in 1997 (and 1993 and 2000)

Screen Shot 2019-10-12 at 2.17.22 PM.png

“Ontario was really good to me, like really really really good”

In his first re-election campaign, Jean Chrétien’s Liberals took 155 of 301 seats for a majority.  It was not the mandate that Chrétien received in 1993 but it was still a majority.  No party has ever relied upon one region so thoroughly as the Liberals did in this campaign – Ontario – where they won 101 of 103 seats.  Ontario accounted for 65% of the Liberal Caucus.  This was due to a stubborn vote split where the PC’s and Reformers played chicken with the Liberals coming out on top.  Even the NDP couldn’t figure out how to steal some seats from the the wily Shawinigan fox in Ontario.  Unlike PET and the Central Canadian Special, Chrétien only won about one-third of the seats in Québec, and also failed to win a majority of seats in the Atlantic and the west, though he had a much stronger showing in the west and north than PET did in 1980.  Chrétien’s Ontario, baby! formula was entirely based on the opposition’s lack of unity.  Though it worked three times, it was not sustainable.

Dominated Ontario, got enough from Québec, Atlantic, and west to reach majority

Paul Martin’s missing majority in 2004

Screen Shot 2019-10-12 at 2.23.01 PM.png

And now the opposition gets organized?!

Paul Martin looked like an unstoppable force when he won the Liberal leadership in 2003 but he was bedevilled by lingering scandal from the decade-old Liberal government.  New Conservative leader Stephen Harper chipped away, as did new NDP leader Jack Layton.  The opposition was now much stronger than the Chrétien years.

Martin did better in the Atlantic and came in about the same in the west as Chrétien, but he could not replicate the Ontario dominance and fell a bit in Québec.  Losing 31 seats in Central Canada cost him the majority.  Under any other circumstance, winning 70% in Ontario would be a huge accomplishment but it wasn’t the 98% that Chrétien had, and he couldn’t make those seats up in other regions.

Strong majority in Ontario and Atlantic, weak in Québec and the west

Justin Trudeau’s all-in majority in 2015
Justin Trudeau’s majority in 2015 (54% of seats) was unlike these other examples.  It was much more balanced than his father’s majority in 1980 – not as dependent on Québec and much stronger in the west, winning almost 30% of the seats there (the most of any example discussed).  Justin won two-thirds of the seats in Ontario, half in Québec, and 100% in Atlantic Canada.  There were no glaring regional weaknesses.  Of all the examples, this was the most regionally representative.

Strong majority in Ontario, dominant in Atlantic, majority in Québec, competitive in west

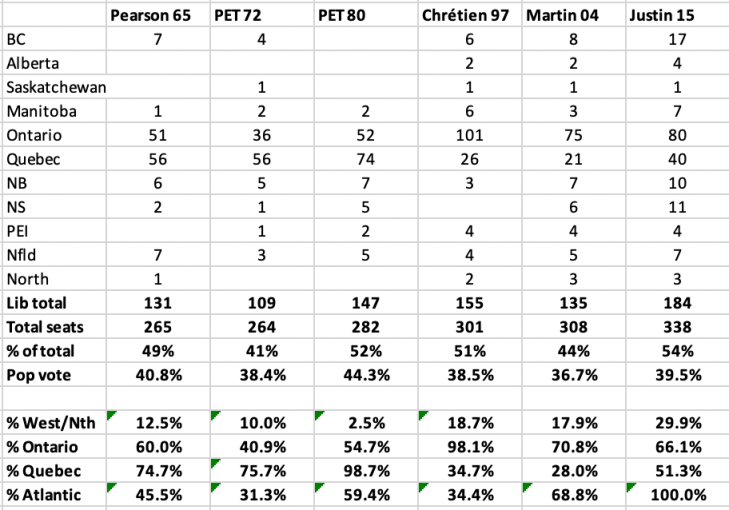
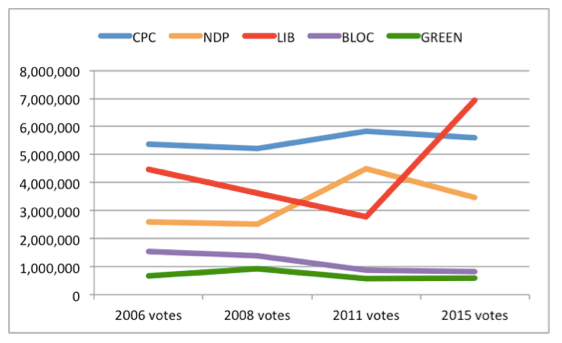
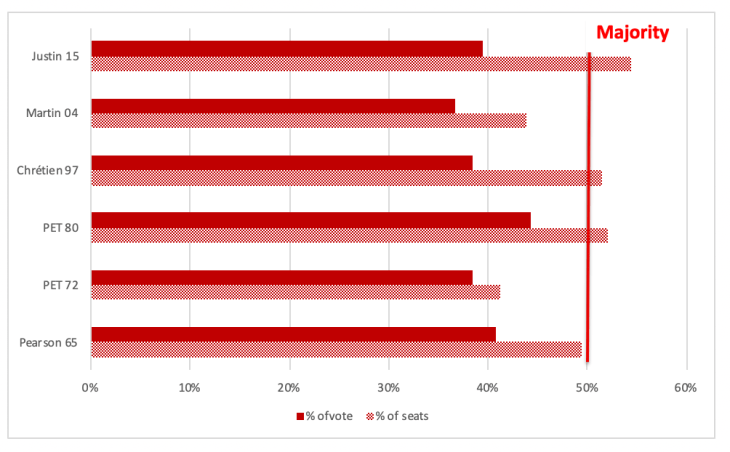
Chart 1: Results from six Liberal wins (popular vote %, and seat %)

Screen Shot 2019-10-12 at 2.29.52 PM.png

What it means for Justin Trudeau, this time

Screen Shot 2019-10-13 at 1.19.16 PMThe examples discussed demonstrate that you can win by utterly dominating a large region, as PET did in 1980 and Chrétien did in 1993, 1997, and 2000.  However, if there’s not domination, there must be some regional balance.  Justin Trudeau’s pathway is regional balance.

It looks like it will be very difficult to replicate the regional strength he had in 2015.  Seats will be given up in the Atlantic.  The Bloc Québécois is a stronger contender this time making it difficult to hold 40 seats (not impossible).  The likely pathway to victory is a strong majority of seats in Ontario and Atlantic, bolstered by getting enough seats out of Québec and the west to win a plurality.  Without regional dominance, it depends on broad popular support, which works on a rising tide, but can be fatal when the tide goes out.  The Liberal 2019 position looks very similar to the regional shape of Paul Martin’s 2004 results.  It does not look like 1972 when PET nearly lost his first re-election bid.  Justin Trudeau is much stronger in ROC, but weaker in Québec than his father.  The final week will show if the Liberals can stay on a pathway to victory.  Like the Conservative pathway, it is not an easy one.

**

Table 1: Results from six Liberal wins

Screen Shot 2019-10-14 at 9.01.05 AM.png


Electoral Wipe-Outs and the Aftermath

Ontario Liberals are looking into the abyss.  This isn’t news.  Premier Kathleen Wynne said as much already when she conceded defeat, a rare admission by a campaigning incumbent Premier.

But how bad will it be?  And then what?

Screen Shot 2018-06-06 at 2.38.14 PM.png

It’s just politics.  Rt. Hon. Kim Campbell on Election Night, 1993.

We’ll know Thursday night where the Liberals will stand, but they stand to face drastic losses.  Reaching 10 seats at this point will be a triumph.  Our numbers at Pollara Strategic Insights, applied to a seat model, indicate there is a greater likelihood that they will be reduced to five or less seats.

Canadian politics provides us with several examples of tsunami elections where incumbent governments were literally washed away:

  • 1987 New Brunswick (58 Liberal, 0 PC).  Premier Richard Hatfield had governed uninterrupted since 1971, but by the mid 1980s, his government had lost its way, not to mention Hatfield’s own personal scandals.  Upstart Liberal leader Frank McKenna mobilized the electorate behind his active, youthful leadership.
  • 1993 Canada (PC’s reduced from 169 seats to 2 seats).  After two successive majority PC governments, the fallout of the Charlottetown Accord defeat, rise of Preston Manning’s Reform Party, and imposition of GST had dealt fatal blows to the Mulroney government.  Despite leadership change and the first and only female prime minister in Canadian history, the PCs were obliterated.  The Liberals had been dealt a hobbling blow themselves in 1984 -their worst outcome since Confederation.  Not only did they return with a majority under Jean Chretien in 1993, a key part of three successive wins was their utter domination of Ontario.
  • 2001 BC (77 BC Liberals, 2 NDP).  The BC NDP pulled a rabbit out of the hat in 1996 when incumbent NDP Premier Mike Harcourt gave way to one of his ministers, Glen Clark.  Clark won a majority by a thin margin.  However, Clark’s government was quickly under siege early and never recovered.  Clark resigned and Ujjal Dosanjh led the NDP into an electoral clearcut.  Gordon Campbell’s BC Liberals won the largest majority in the province’s history.

Screen Shot 2018-06-06 at 9.15.50 PM.png

There are examples where governing parties have been rendered extinct – the BC Social Credit, United Farmers of Alberta, Alberta Social Credit, Saskatchewan PCs, and Union Nationale come to mind.

The Ontario Liberals look to finish well below Richard Hatfield’s PCs and Ujjal Dosanjh’s NDP in terms of popular vote.  They have fallen below the “pitchfork line” – my newly coined phrase that I am marketing to Canada’s political science professors. It’s that line where – once crossed – a government will never recover because a critical mass of voters is so angry that the incumbent government cannot overcome that passion and intensity.

It’s hard to believe that the Ontario Liberals will become a political DoDo bird.  It’s more likely they will rise again, in due course.  Among the stages of recovery:

  • Mourning
  • Walk of humility
  • The professional class gives way to the true believers and new believers
  • New governments eventually screw up, therefore, opportunity
  • Momentum builds for a comeback
  • Time passes, change is inevitable

1987 New Brunswick – the PCs came back and won the first election after the retirement of McKenna.  It took a while to rebuild and the flash-in-the-pan Confederation of Regions Party supplanted the PCs briefly during that period.  But eventually, voters stopped punishing the PCs and Bernard Lord’s PCs returned to power in 1999. (12 year recovery)

1993 Canada – From two seats, the PCs climbed to official party status, then the merger with the Canadian Alliance, which had evolved itself from the Reform Party.  After forcing a minority in 2004, Stephen Harper won the 2006 election and governed for nine years. (13 year recovery)

2001 BC – the NDP were reduced to two of 79 seats.  They roared back in 2005 almost upsetting the Campbell government, and for the next three elections, there was a 4-point standoff between the governing BC Liberals and NDP.  After 16 years, in 2017, the NDP returned to power, with support from the Green Party.  While missing their chance at the 12 year mark, they are there now. (16 year recovery)

Whatever happens on June 7th, the Liberals will not be dead, they will just be resting.  In all likelihood, they will be back some day.  The three-party system is well-established in Ontario. Maybe it will be the 12 to 16 year range like the examples above.  Or maybe the volatility of today’s politics will expedite that process.

I will draw from my own personal experience.  My first campaign was in 1984 when as a Liberal in the Mission-Port Moody riding, I saw the pitchforks first-hand.  Voters were very angry with the Pierre Trudeau government and weren’t buying the change that John Turner offered as his replacement.  While burma-shaving on the Lougheed Highway in that summer campaign, the rage emanating from the commuters was hotter than the pavement we were standing on.  We were clobbered, going from government to 40 seats – the most humiliating defeat for the Liberal Party since Confederation.  Yet, the Party rebuilt, made a hard charge during the 1988 election, and then won a decisive majority in 1993.  A nine year recovery.

In 1988, I was on hand for Liberal Sharon Carstairs’ amazing breakthrough from one to 20 seats in Manitoba, only a few seats from governing.  Then again in 1991, for BC Liberal Gordon Wilson’s rise to Official Opposition from zero seats.  Turnarounds can be faster than people expect, especially in the social media age.  I mean, six months ago, did anyone – anyone – expect Doug Ford would be the next Premier of Ontario?  Anything can happen.

Ontario Liberals can learn from the 2011 federal election and events thereafter.  It was a humiliating loss for Michael Ignatieff’s Liberals and many touted a Liberal-NDP merger, with the NDP having the strong hand.  Until halfway through the 2015 election campaign, it looked like Tom Mulcair’s NDP were the primary opposition to Harper.  Justin Trudeau turned the tables and governs today, taking his party from third to first in probably the most dramatic comeback in Canadian political history.

A huge loss can be a good loss.  It allows for new growth and regeneration.  The Liberals will shake off “government-itis” in the face of the obvious. Voters will want to see that the Party has learned its lesson, has changed, and is offering new leadership.  Internally, the party will need to heal and unify.

Electoral wipe outs – and subsequent recoveries – speak well for our system.   There is elasticity.  Voters are in charge, punishing when they are mad, generous to parties that change and renew.  Parties that can take a punishing hit, rebuild, and contend for power are examples of parties that strive to be inclusive, rather than staying in a narrow box that only appeals to a narrow slice of voters (like the Greens, for example).  For Ontario Liberals, this phase may be over, but it will also be the beginning of something new.

Voter Turnout lessons and what it means for Ontario

Update: My editorial in the Globe & Mail (June 6, 2018)

Ontario voters will render their verdict on June 7th.

It’s a very significant election.  The Liberals have governed since 2003.  A change in Ontario – either to Doug Ford’s PCs or Andrea Horwath’s NDP – will be a major tone-setter for national politics and influence the make up of the issues heading into the 2019 federal election, not to mention the impact it would have on one of the largest sub-national economies in the world.

But of course, only those who actually vote get to decide.  Millions of Ontario residents will avoid the polls altogether.

Screen Shot 2018-05-26 at 9.16.04 AM.png

Who will end up voting to elect the next Premier of Ontario? (Photo: CBC)

The recent BC election and 2015 federal election provide insight into who will show up to the polls in Ontario, and what it means for parties when the overall voter pool grows, and by how much.

You can’t stand still while the voter pool grows

Like the Ontario Liberals, the BC Liberals won four consecutive elections in BC – and like the Ontario Liberals – a female leader replaced a three-term Premier and won an improbable fourth term for her party.

In the case of BC, Christy Clark succeeded in holding her Party’s overall raw vote and its market share, especially in relation to the BC NDP, and won a majority in 2013.  In 2017, Clark’s BC Liberals still held their raw vote (almost identically), but the voter pool grew resulting in a loss of market share.  The Greens surged and the NDP bridged the gap.  Result: a minority government and we all know how that turned out.

Chart 1:  Raw vote for BC parties (1996-2017)

Screen Shot 2018-05-24 at 9.52.49 PM.png

In fact, when looking at BC’s historic forces of “Free Enterprise” versus “The Left”, the change over time is quite dramatic.  Free Enterprise has been sitting at around 800,000 voters for 20 years while the NDP/Greens have nearly doubled.  It finally caught up to “Free Enterprise” in 2017.

Chart 2:   Raw vote for Free Enterprise (BC Libs/Right wing parties) vs. NDP/Greens (1996-2017)

Screen Shot 2018-05-24 at 9.59.07 PM.png

The number of voters in BC provincial elections has climbed steadily since 2009 after a dip, with the total now reaching close to two million. Federal turnout was not that much different than provincial turnout from 2000 to 2011, but exploded in 2015.  Close to 2.4 million British Columbians voted, 20% more than the 2017 BC election.

Chart 3: Total number of voters in British Columbia in recent provincial and federal elections (BC only)

Screen Shot 2018-05-24 at 10.03.01 PM.png

The federal Conservatives – like the BC Liberals in 2017 – held their raw vote in 2015, but lost market share because almost three million more Canadians cast ballots in 2015 compared to the previous election. The Conservatives were happy with their slice of the pie in 2011, but Justin Trudeau helped bake a bigger pie leaving the Conservatives with their same old slice.  The Liberals were clearly the beneficiary of the increased turnout.

Chart 4: Federal parties’ raw vote totals (2006-2015)

Screen Shot 2018-05-24 at 10.07.20 PM.png

It also matters where you hold your vote.  Both the Clark BC Liberals and Harper Conservatives actually increased their raw vote in their heartland.  The BC Liberals cleaned up in the Interior while the Conservatives thumped the other parties in Alberta (and gained votes in Quebec).  But they both lost ground in the vote-rich urban regions.

A study of federal voter turnout among registered voters between 2011 and 2015 showed that there was increased turnout in all age groups, but the largest increase was among younger voters.

Chart 5: Turnout rate of registered voters by age group (2011 and 2015 federal elections)

Screen Shot 2018-05-24 at 10.12.16 PM.png

So, increased voter turnout, means more young people voting, meaning bad news for centre-right parties.  Got it?

Actually, it’s a bit more complicated than that.

Federal turnout in 2015 was quite exceptional.  It blew the lid off of previous federal elections and, as shown above, the 2017 BC election did not replicate that level of turnout.  Turnout increased, but it wasn’t “Justin-sized”.

In BC, the Golden Agers still rule the roost.  Those aged 55 to 74 punch above their weight.  Compared to their share of the population, those age groups make up a much bigger share of the voter pool.  The 55-64 age group makes up about 17% of the adult population but accounts for about 21% of the voters; the 65-74 age group makes up about 13% of the population but 18% of the voters. Combined, about 30% of the population have close to 40% of the voting strength.  Add the over 75s, who also have a disproportionately large share of voting strength, and you have half of the voting population over the age of 55.

The reverse is true, obviously, for younger voters, particularly those under 35.  Those voters make up about 28% of the population but only about 18% of the voters in BC.

Chart 6: BC age groups as a percentage of the population and as a percentage of voters

Screen Shot 2018-05-24 at 10.19.32 PM.png

When looking at how age groups compared between the 2013 and 2017 provincial elections, there are interesting findings.  The largest increase by age group was the 65-74s with over 60,000 more voters in that category in 2017.  The next largest increase was 25-34s at close to 40,000.  What explains this?  Demographics partly, but there may be a mini-Justin effect with the Greens inducing turnout (a theory, not proven) and it may have been a result of third-party turnout activism (again, not proven).  These numbers are also the result of Elections BC estimate so we also have to assume they got it right, but it rings true to me. (Not sure what’s going on with that 45-54 category – did I remember to vote?)

Chart 7: Increase in votes by age category between 2013 and 2017 BC elections

Screen Shot 2018-05-24 at 10.25.27 PM.png

Was the increase in 25-34s concentrated in the Lower Mainland where the BC Liberals suffered heavy losses? I don’t know.  It would be an interesting study to see where in BC the largest increases took place.

The increase in 65-74s – and indeed increases across the board among 55+ age groups, should have been a good thing for the BC Liberals.  The fact is – they didn’t do as well as 2013 with their base.  It wasn’t just young people showing up that made a difference; it was a lack of performance among previous BC Liberal voters.

What does this mean for Ontario?

Let’s take a look at how Ontario provincial elections compare to federal elections when it comes to turnout.

Federal turnout has been consistently higher.   In 2015, 6.5 million Ontario voters galloped to the polls to vote in the federal election, yet no Ontario provincial election has ever seen more than five million voters.

Chart 8: Comparison of number of Ontario voters voting in recent federal and Ontario elections

Screen Shot 2018-05-24 at 10.34.21 PM.png

Historical election data in Ontario shows us that – only once – has a political party received over two million votes (Premier Dalton McGuinty’s Liberals in 2003)

Chart 9: Ontario elections since 1990 – total votes and top party votes

Screen Shot 2018-05-24 at 10.42.03 PM.png

Taking turnout into account relative to federal elections, how many voters can we expect in the June 2018 election in Ontario?  And how many votes will the top party need?

The 2014 election saw provincial turnout at 88% of the level of the dull 2011 federal election.  If the 2018 Ontario election is 88% of the sizzling 2015 federal election, then that would equate to 5.7 million voters in June. That would be a huge increase. I don’t think that’s going to happen.  I think, like BC, there will be an increase in the voter pool – over 5 million for the first time – but probably not as high as 5.7 million.  Even with an increase north of five million, the winning party will likely need a record-setting vote total (+two million) or hope for a good vote split.

Then, who votes?

It is more likely that Ontario’s age composition will resemble BC’s 2017 profile than Canada’s 2015 profile – older people having a disproportionate share.

I looked at the share of each age group in the 2011 and 2015 federal elections, and the BC 2017 election, and applied those ratios to Ontario’s population.  Based on these three scenarios, 55+ age group would account for 42% to 48% of the voters in the coming election, compared to 38% share of the population.

Chart 10: Ontario population by age group compared to age models from 2011 and 2015 federal elections, and 2017 BC election

Screen Shot 2018-05-24 at 10.47.05 PM.png

Does it matter in Ontario?  Typically, the 55+ age group leans right relative to younger voters.  This was certainly the case federally in 2015 and in BC in 2017.

However, in Pollara Strategic Insight’s mid-election survey of Ontario voters, we found that the NDP had gained 7 points among voters aged 50 and over during the first half of the campaign, taking the lead in this category of high-turnout voters.

Chart 11: Pollara Strategic Insights survey results of Ontario election, May 4 & 22, 2018 (50+ voters)

Screen Shot 2018-05-25 at 5.56.14 AM.png

The striking difference in Ontario is the gender split, with men more likely to vote PC, and women more likely to vote NDP at this stage of the campaign.  From what I have seen over the years, there is not a major turnout difference between men and women, like there is with age.

If the poll results stand, the NDP will have blunted a major advantage for the PCs – support among older voters.  Geographically, there is likely still a PC advantage.  The NDP may be gaining in key demographics, but at the end of the day, it matters where the votes are located – in the ridings.  (More on seat models another day).

Pollara’s research also finds an “enthusiasm” advantage for Doug Ford’s PCs.  Ford Nation is already lining up at the polling stations to vote, they’re so excited, though slightly less so than earlier in the campaign.  The NDP voters are the least excited.  Is that just their nature or is their rise in support a bit thin? In terms of impact on votes, if Ford over performs the polls on Election Day, it may well be because he was throwing red meat to his base, regardless of their age.

Chart 12: Pollara Strategic Insights survey results of Ontario election, May 4 & 22, 2018 (Enthusiasm Gap)

Screen Shot 2018-05-25 at 6.05.34 AM.png

What does it all mean?

  • When the voter pool grows, parties must grow with it or perish.
  • Older voters (55+) still rule the roost and constitute a majority (or close to it).  They punch above their demographic weight at the polls.  The party with an advantage in this age group will have a turnout advantage.
  • Youth turnout continues to lag behind, but it is growing and becoming a bigger factor.
  • While it will likely be a record turnout for an Ontario election, it is very unlikely that the June election will keep pace with 2015 federal turnout. The unknown is to what extent 55+ age group exerts control over the outcome, or whether Millennials offset their influence by voting in increased numbers.


Three lessons for Ontario from B.C. and the world of outrageous politics

Published in Globe & Mail, March 2 / 2018

As Ontario PC members and interested observers brace for the finale of an unanticipated and compressed leadership race, they may wish to take note of how BC Liberals recently selected Christy Clark’s successor using basically the same voting system. Instead of outrageous politics, the boring math will decide the next PC leader, and maybe the next Ontario Premier.

Three key points:

1) Some votes count more than others: In British Columbia, Andrew Wilkinson prevailed in the six-candidate race despite having the fifth-highest number of votes on the first count. How did he win?

It’s a weighted ballot. Every riding is created equally. A riding is worth 100 points, and points are allocated according to the percentage of votes received by each candidate. In Mr. Wilkinson’s case, while he had the fifth-highest number of raw votes on the first count, he had the third-highest number of points because he did well in ridings that had low membership levels (mainly in B.C.’s Interior) where his supporters had higher impact.

 Another candidate, Michael Lee, had more votes than anyone in the race but finished third because his support was concentrated in ridings with big membership lists.


2) First choices are important, but second and third choices will decide: It’s a preferential ballot, meaning that you only vote once and you have the opportunity to rank your choices. In the Ontario PC race, there are four candidates.

Mr. Wilkinson started third on the first ballot with only 18 per cent of the weighted votes, but he won. He made huge progress on the third count, and by the fourth count he was second, ultimately winning on the fifth and final count. He climbed throughout the counting process because he accumulated more second and third choices than any other candidate. He especially gained from former finance minister Michael de Jong, with whom he had a formal alliance to support each other as second choice, and from Mr. Lee, whose supporters decisively preferred Mr. Wilkinson over his final-ballot rival, Dianne Watts.

3) Not every voting member stays in the “convention hall” to the end: In the old days, delegates voted on the first ballot, heard the result, then lined up and voted again, and kept doing so until one candidate had a majority. In the Ontario PC system (as was the case in B.C.), members do all of their voting in advance, which means ranking their candidates from 1 to 4. However, they do not have to rank all of the candidates. They can just vote for their first choice if they want, but they might find that their ballot won’t count when it comes down to the final two candidates.

In the BC Liberal race, about one-quarter of the voters who cast a vote on the first count did not have their ballots considered on the final count. They had essentially “walked out of the convention hall” as they did not express a preference for either Mr. Wilkinson or the runner-up, Ms. Watts. Since they had only voted for candidates already eliminated, their ballots were removed from the counting process. Smart candidates will plead for second and third choices from voters who might otherwise “leave the hall.”

 The outcome in B.C. was certainly unpredictable. When it comes down to who wins, the next Leader of the Ontario PCs may be the one who is the best at math.