Update: My editorial in the Globe & Mail (June 6, 2018)
Ontario voters will render their verdict on June 7th.
It’s a very significant election. The Liberals have governed since 2003. A change in Ontario – either to Doug Ford’s PCs or Andrea Horwath’s NDP – will be a major tone-setter for national politics and influence the make up of the issues heading into the 2019 federal election, not to mention the impact it would have on one of the largest sub-national economies in the world.
But of course, only those who actually vote get to decide. Millions of Ontario residents will avoid the polls altogether.
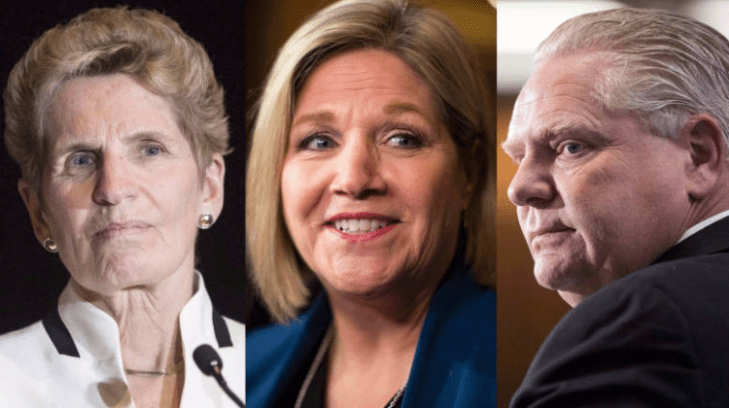
Who will end up voting to elect the next Premier of Ontario? (Photo: CBC)
The recent BC election and 2015 federal election provide insight into who will show up to the polls in Ontario, and what it means for parties when the overall voter pool grows, and by how much.
You can’t stand still while the voter pool grows
Like the Ontario Liberals, the BC Liberals won four consecutive elections in BC – and like the Ontario Liberals – a female leader replaced a three-term Premier and won an improbable fourth term for her party.
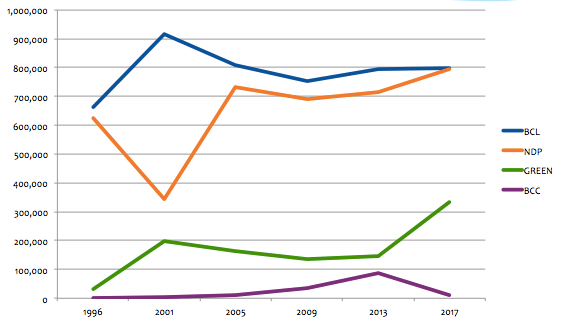
In the case of BC, Christy Clark succeeded in holding her Party’s overall raw vote and its market share, especially in relation to the BC NDP, and won a majority in 2013. In 2017, Clark’s BC Liberals still held their raw vote (almost identically), but the voter pool grew resulting in a loss of market share. The Greens surged and the NDP bridged the gap. Result: a minority government and we all know how that turned out.
Chart 1: Raw vote for BC parties (1996-2017)
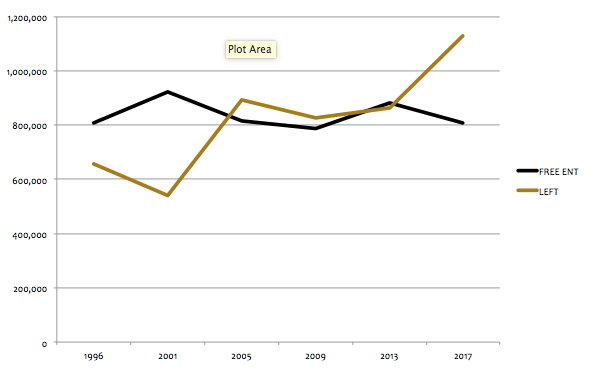
In fact, when looking at BC’s historic forces of “Free Enterprise” versus “The Left”, the change over time is quite dramatic. Free Enterprise has been sitting at around 800,000 voters for 20 years while the NDP/Greens have nearly doubled. It finally caught up to “Free Enterprise” in 2017.
Chart 2: Raw vote for Free Enterprise (BC Libs/Right wing parties) vs. NDP/Greens (1996-2017)
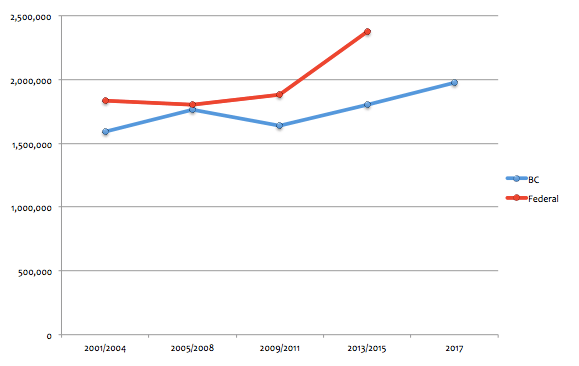
The number of voters in BC provincial elections has climbed steadily since 2009 after a dip, with the total now reaching close to two million. Federal turnout was not that much different than provincial turnout from 2000 to 2011, but exploded in 2015. Close to 2.4 million British Columbians voted, 20% more than the 2017 BC election.
Chart 3: Total number of voters in British Columbia in recent provincial and federal elections (BC only)
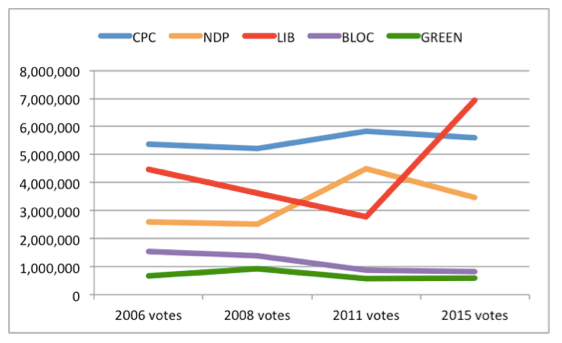
The federal Conservatives – like the BC Liberals in 2017 – held their raw vote in 2015, but lost market share because almost three million more Canadians cast ballots in 2015 compared to the previous election. The Conservatives were happy with their slice of the pie in 2011, but Justin Trudeau helped bake a bigger pie leaving the Conservatives with their same old slice. The Liberals were clearly the beneficiary of the increased turnout.
Chart 4: Federal parties’ raw vote totals (2006-2015)
It also matters where you hold your vote. Both the Clark BC Liberals and Harper Conservatives actually increased their raw vote in their heartland. The BC Liberals cleaned up in the Interior while the Conservatives thumped the other parties in Alberta (and gained votes in Quebec). But they both lost ground in the vote-rich urban regions.
A study of federal voter turnout among registered voters between 2011 and 2015 showed that there was increased turnout in all age groups, but the largest increase was among younger voters.
Chart 5: Turnout rate of registered voters by age group (2011 and 2015 federal elections)

So, increased voter turnout, means more young people voting, meaning bad news for centre-right parties. Got it?
Actually, it’s a bit more complicated than that.
Federal turnout in 2015 was quite exceptional. It blew the lid off of previous federal elections and, as shown above, the 2017 BC election did not replicate that level of turnout. Turnout increased, but it wasn’t “Justin-sized”.
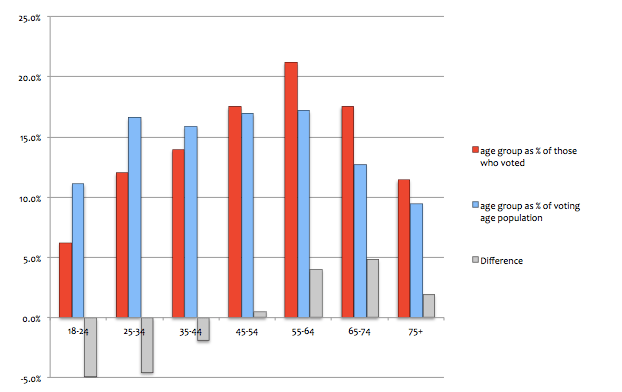
In BC, the Golden Agers still rule the roost. Those aged 55 to 74 punch above their weight. Compared to their share of the population, those age groups make up a much bigger share of the voter pool. The 55-64 age group makes up about 17% of the adult population but accounts for about 21% of the voters; the 65-74 age group makes up about 13% of the population but 18% of the voters. Combined, about 30% of the population have close to 40% of the voting strength. Add the over 75s, who also have a disproportionately large share of voting strength, and you have half of the voting population over the age of 55.
The reverse is true, obviously, for younger voters, particularly those under 35. Those voters make up about 28% of the population but only about 18% of the voters in BC.
Chart 6: BC age groups as a percentage of the population and as a percentage of voters
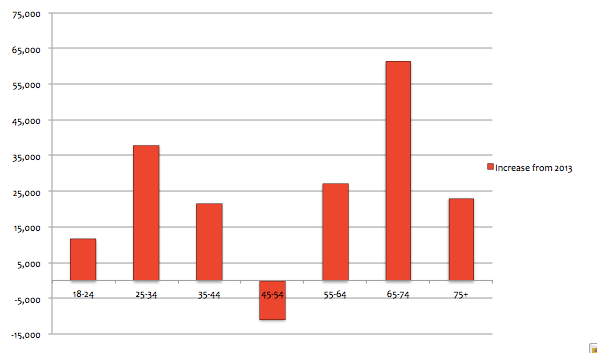
When looking at how age groups compared between the 2013 and 2017 provincial elections, there are interesting findings. The largest increase by age group was the 65-74s with over 60,000 more voters in that category in 2017. The next largest increase was 25-34s at close to 40,000. What explains this? Demographics partly, but there may be a mini-Justin effect with the Greens inducing turnout (a theory, not proven) and it may have been a result of third-party turnout activism (again, not proven). These numbers are also the result of Elections BC estimate so we also have to assume they got it right, but it rings true to me. (Not sure what’s going on with that 45-54 category – did I remember to vote?)
Chart 7: Increase in votes by age category between 2013 and 2017 BC elections
Was the increase in 25-34s concentrated in the Lower Mainland where the BC Liberals suffered heavy losses? I don’t know. It would be an interesting study to see where in BC the largest increases took place.
The increase in 65-74s – and indeed increases across the board among 55+ age groups, should have been a good thing for the BC Liberals. The fact is – they didn’t do as well as 2013 with their base. It wasn’t just young people showing up that made a difference; it was a lack of performance among previous BC Liberal voters.
What does this mean for Ontario?
Let’s take a look at how Ontario provincial elections compare to federal elections when it comes to turnout.
Federal turnout has been consistently higher. In 2015, 6.5 million Ontario voters galloped to the polls to vote in the federal election, yet no Ontario provincial election has ever seen more than five million voters.
Chart 8: Comparison of number of Ontario voters voting in recent federal and Ontario elections
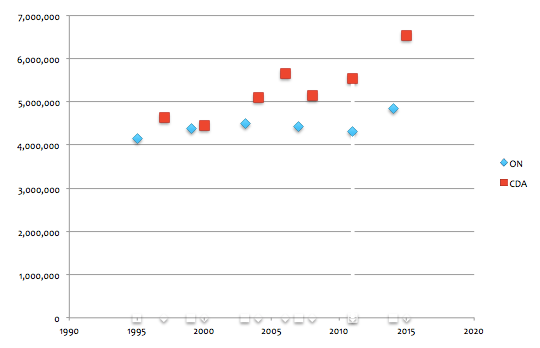
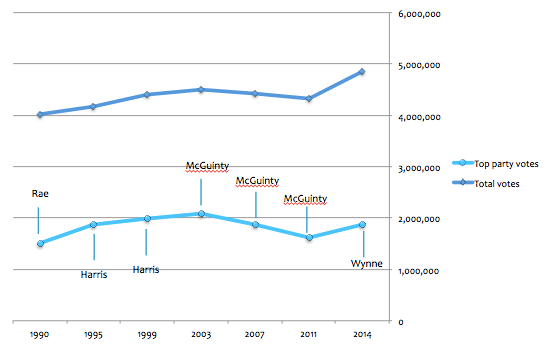
Historical election data in Ontario shows us that – only once – has a political party received over two million votes (Premier Dalton McGuinty’s Liberals in 2003)
Chart 9: Ontario elections since 1990 – total votes and top party votes
Taking turnout into account relative to federal elections, how many voters can we expect in the June 2018 election in Ontario? And how many votes will the top party need?
The 2014 election saw provincial turnout at 88% of the level of the dull 2011 federal election. If the 2018 Ontario election is 88% of the sizzling 2015 federal election, then that would equate to 5.7 million voters in June. That would be a huge increase. I don’t think that’s going to happen. I think, like BC, there will be an increase in the voter pool – over 5 million for the first time – but probably not as high as 5.7 million. Even with an increase north of five million, the winning party will likely need a record-setting vote total (+two million) or hope for a good vote split.
Then, who votes?
It is more likely that Ontario’s age composition will resemble BC’s 2017 profile than Canada’s 2015 profile – older people having a disproportionate share.
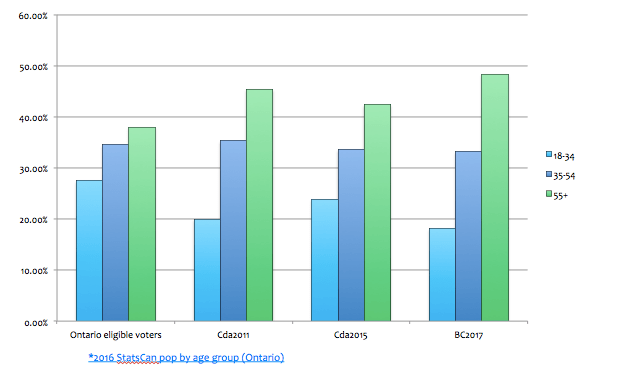
I looked at the share of each age group in the 2011 and 2015 federal elections, and the BC 2017 election, and applied those ratios to Ontario’s population. Based on these three scenarios, 55+ age group would account for 42% to 48% of the voters in the coming election, compared to 38% share of the population.
Chart 10: Ontario population by age group compared to age models from 2011 and 2015 federal elections, and 2017 BC election
Does it matter in Ontario? Typically, the 55+ age group leans right relative to younger voters. This was certainly the case federally in 2015 and in BC in 2017.
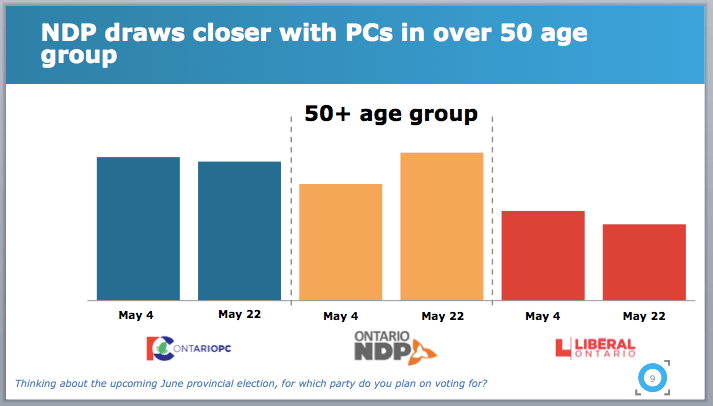
However, in Pollara Strategic Insight’s mid-election survey of Ontario voters, we found that the NDP had gained 7 points among voters aged 50 and over during the first half of the campaign, taking the lead in this category of high-turnout voters.
Chart 11: Pollara Strategic Insights survey results of Ontario election, May 4 & 22, 2018 (50+ voters)
The striking difference in Ontario is the gender split, with men more likely to vote PC, and women more likely to vote NDP at this stage of the campaign. From what I have seen over the years, there is not a major turnout difference between men and women, like there is with age.
If the poll results stand, the NDP will have blunted a major advantage for the PCs – support among older voters. Geographically, there is likely still a PC advantage. The NDP may be gaining in key demographics, but at the end of the day, it matters where the votes are located – in the ridings. (More on seat models another day).
Pollara’s research also finds an “enthusiasm” advantage for Doug Ford’s PCs. Ford Nation is already lining up at the polling stations to vote, they’re so excited, though slightly less so than earlier in the campaign. The NDP voters are the least excited. Is that just their nature or is their rise in support a bit thin? In terms of impact on votes, if Ford over performs the polls on Election Day, it may well be because he was throwing red meat to his base, regardless of their age.
Chart 12: Pollara Strategic Insights survey results of Ontario election, May 4 & 22, 2018 (Enthusiasm Gap)

What does it all mean?
- When the voter pool grows, parties must grow with it or perish.
- Older voters (55+) still rule the roost and constitute a majority (or close to it). They punch above their demographic weight at the polls. The party with an advantage in this age group will have a turnout advantage.
- Youth turnout continues to lag behind, but it is growing and becoming a bigger factor.
- While it will likely be a record turnout for an Ontario election, it is very unlikely that the June election will keep pace with 2015 federal turnout. The unknown is to what extent 55+ age group exerts control over the outcome, or whether Millennials offset their influence by voting in increased numbers.

Good article Mike
LikeLike
Thanks Bob. High praise!
LikeLike
Mike, I really enjoyed this Voter Turnout article. Your analysis, as always, is most interesting. With our civic elections on the near horizon, are there any similarities in terms of voter age/ gender/ economic status that underlie municipal voting patterns? Mike H
LikeLike
Thank you. My assumption would be that the trend is more pronounced – disproportionate in favour of age and also length of residency in the community. The more that people feel attached to their jurisdiction, the more likely they are to vote.
LikeLike