The Top 2 parties routinely took three-quarters of the popular vote between them until Preston Manning and Lucien Bouchard came along and blew up Canada’s political landscape. It hasn’t been the same since.
Going back to John Diefenbaker’s win in 1957 through to Brian Mulroney’s win in 1988, the Progressive Conservatives and Liberals had a duopoly, averaging 77% between them in the elections over that time. Since 1993, the top 2 parties have averaged only 66% between them, with other parties taking a greater share of the popular vote. And sometimes, the Liberals and Conservatives weren’t even in the top 2.
In 1993, the Progressive Conservative Party, which had won back-to-back majorities, disintegrated due to the centrifugal forces of the failure of the Meech Lake Accord and the imposition of the GST, plus a bunch of other stuff. The day after the 1993 election, those wearing blue pyjamas woke up in cold sweats facing a Quebec separatist party as Official Opposition led by a former senior Minister in the Mulroney government, a western alienation party as the third party led by a prominent small c conservative, and, relegated to fourth place, the once mighty PC party reduced to two seats. A waking nightmare! I imagine there is a plaque at the Albany Club that refers to this dark day.
Since 1993, the Top 2 parties have only combined for over 70% of the votes only twice – both when majority governments were formed (Harper 2011, Trudeau 2015).
The chart below shows the combined popular vote of the top 2 parties since 1957. For the most part, the Liberals (red) and (pre 1993-Progressive) Conservatives (blue) have been the top two parties. In terms of popular vote, the Reform Party and Canadian Alliance (purple) were 2nd place finishers in 1993, 1997, and 2000 elections. Jack Layton’s NDP (orange) finished second in 2011, the only time in 21 elections the Liberals were not in the Top 2.
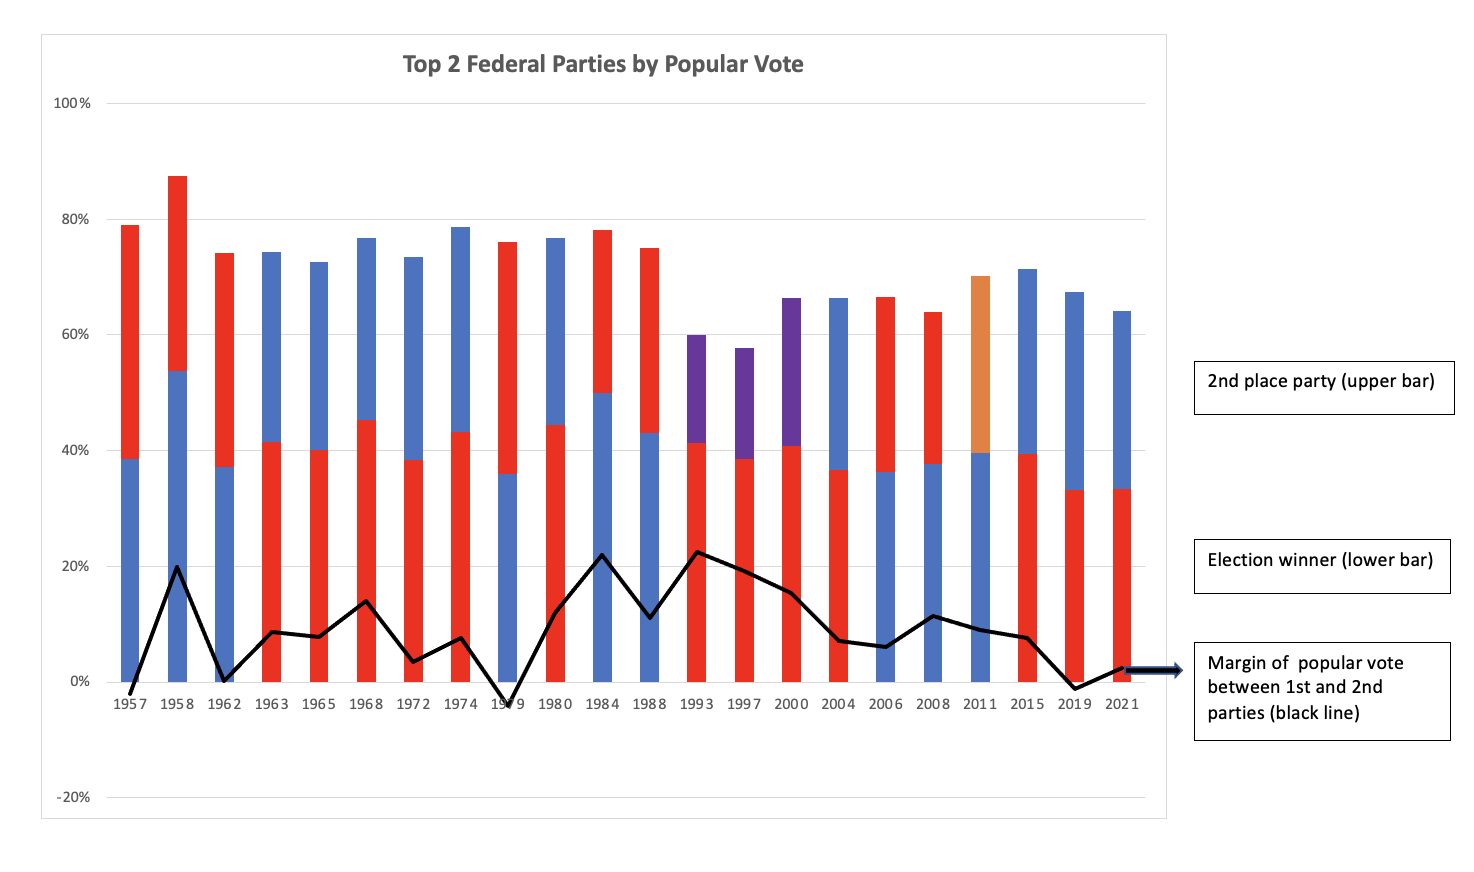
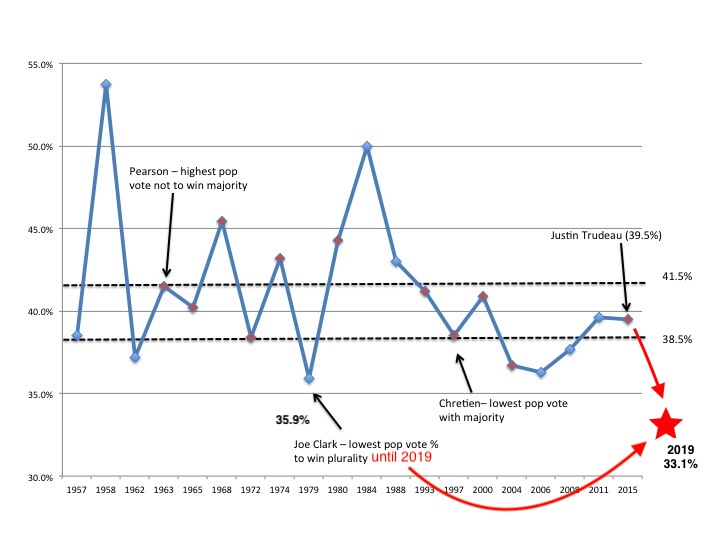
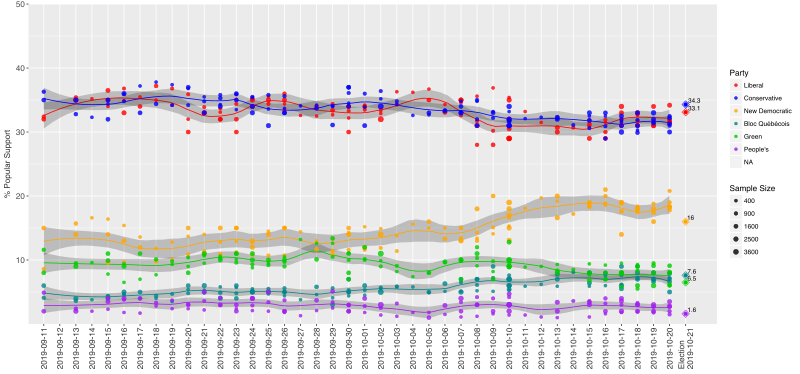
The black line shows the margin of victory (popular vote) between the 1st and 2nd place parties. In two instances, the winning party, that went on to govern, had fewer votes than the 2nd place party. In 1979, Joe Clark’s PC’s won more seats but trailed the Liberals by over 4% in the popular vote. In 2019, Andrew Scheer’s Conservatives won the popular vote by about 1% but Justin Trudeau’s Liberals had more seats. Polling as of August 24th is shown, accounting for a combined 64% between the top 2 parties.
What the black line does show is that majorities happen when there is a significant margin between the top 2 parties. In the 1990s, when the Top 2 parties had less share of the vote, Jean Chrétien’s Liberals were walloping the split conservative factions, divided between Reform/Alliance and the PCs. Chrétien’s margin of victory was between 15% to 23% over those three elections. The right wingers got the ol’ Shawinigan handshake in those days.
It’s tightened up since then due to the Conservative merger leading into the 2004 election. Harper and Trudeau won majorities with 9% and 8% margins of victory respectively. In fact, since Diefenbaker, no party has won a majority with less than a 7.7% margin of victory. (Harper missed a majority in 2008 despite winning the popular vote by 11% – no matter how many votes you get in Alberta, you can only win a riding once per election)
It doesn’t mean that a majority can’t be won with a margin lower than 7%. Last election, the Trudeau Liberals were only 13 seats shy of a majority despite losing the popular vote. They had very efficient vote distribution. With votes in the right places, they could win a majority with less than a 5% margin over the Conservatives – and they would be making history if they did so. Right now, the public polls indicate the gap has tightened between the two parties in the first week of the campaign so if either party is going to take a majority, they have work to do.
It’s tough enough for any party to get to 40% these days, making the 50%+ wins of Diefenbaker in 1957 and Mulroney in 1984 ever more impressive. Both Progressive Conservatives, go figure.
The growing share of other parties since 1993 also makes it tougher to win a majority. The NDP, the Greens, and, most notably, the Bloc are taking seats off the table from the Top 2 parties. It was easy for Chrétien when he could dominate a split opposition just as it was easy for Harper in 2011 when he the centre-left was split. In the context of a competitive two-way race, with lots of other parties cluttering the landscape, it will take a combination of overall popular vote strength and efficiency, meaning winning more seats by a little versus winning fewer seats by a lot.
At the end of the day, we count seats not votes in Parliament. But the history of popular vote signals what it takes to win in the fragmented post-1993 era.
See the data below:
| Govt | 2nd | Other | Total | Margin | |
| 1957 | 39% | 41% | 21% | 79% | -2.0% |
| 1958 | 54% | 34% | 13% | 87% | 19.9% |
| 1962 | 37% | 37% | 26% | 74% | 0.3% |
| 1963 | 41% | 33% | 26% | 74% | 8.7% |
| 1965 | 40% | 32% | 27% | 73% | 7.8% |
| 1968 | 45% | 31% | 23% | 77% | 13.9% |
| 1972 | 38% | 35% | 27% | 73% | 3.4% |
| 1974 | 43% | 35% | 21% | 79% | 7.7% |
| 1979 | 36% | 40% | 24% | 76% | -4.2% |
| 1980 | 44% | 32% | 23% | 77% | 11.9% |
| 1984 | 50% | 28% | 22% | 78% | 22.0% |
| 1988 | 43% | 32% | 25% | 75% | 11.1% |
| 1993 | 41% | 19% | 40% | 60% | 22.6% |
| 1997 | 38% | 19% | 42% | 58% | 19.1% |
| 2000 | 41% | 25% | 34% | 66% | 15.4% |
| 2004 | 37% | 30% | 34% | 66% | 7.1% |
| 2006 | 36% | 30% | 34% | 67% | 6.0% |
| 2008 | 38% | 26% | 36% | 64% | 11.4% |
| 2011 | 40% | 31% | 30% | 70% | 9.0% |
| 2015 | 39% | 32% | 29% | 71% | 7.6% |
| 2019 | 33% | 34% | 33% | 67% | -1.2% |