British Columbia has 42 of Canada’s 338 seats. When the votes are being counted on the evening of October 21st, British Columbians may push one of the contending parties into a plurality, or even a majority.
In 2015, the Liberals won the most seats in British Columbia for the first time since 1968. Heading into BC on election night, the Liberals were three seats short of a majority. A record 17 Liberal seats west of the Rockies gave them a majority, and a comfortable one at that.
Table 1: 2015 BC results and current standings
| Party |
Vote |
Seats |
At dissolution |
Incumbents seeking re-election |
| Liberals |
35%
|
17
|
17 (1 gain, 1 loss) |
16 |
| CPC |
30%
|
10
|
8 (1 loss, 1 vacant) |
8 |
| NDP |
26%
|
14
|
13 (1 loss) |
10 |
| Greens |
8%
|
1
|
2 (1 gain) |
2 |
| Independent |
|
|
JWR |
1 |
Between 1968 and 2015, the leading conservative/right wing party – whether that was Progressive Conservatives, Reform Party, Canadian Alliance, or Conservative Party – had the plurality of seats in BC 11 out of 13 times. Through most elections, the blue team has been at the top while the NDP and Liberals flipped positions. In the 1970s and 1980s, the Liberals were mainly in decline due to a strong sense of western alienation and atrophy of the party’s base in BC. In the 1990s, when the NDP were in power provincially (and unpopular mostly), federal NDP vote plummeted while the populist Reform and Alliance campaigns surged – a populist crossover – demonstrating that BC voting is not strictly a left-right continuum. The Liberals also gained during this time, but plateaued between 1993 and 2006. As the NDP regained strength post-2001 (now out of power provincially), the Liberals slipped again, this time reflecting the party’s woes nationally. It all changed in 2015 when Justin Trudeau brought it full circle back to 1968.
Chart 1: Popular vote and seats in BC from 1968 to 2015
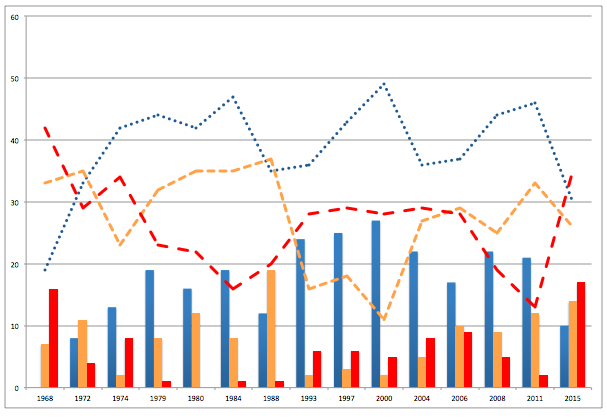
Liberal (red); NDP (orange); leading conservative party (blue): PC (1968-88); Reform (1993-97): Canadian Alliance (2000); Conservative (2004-15)
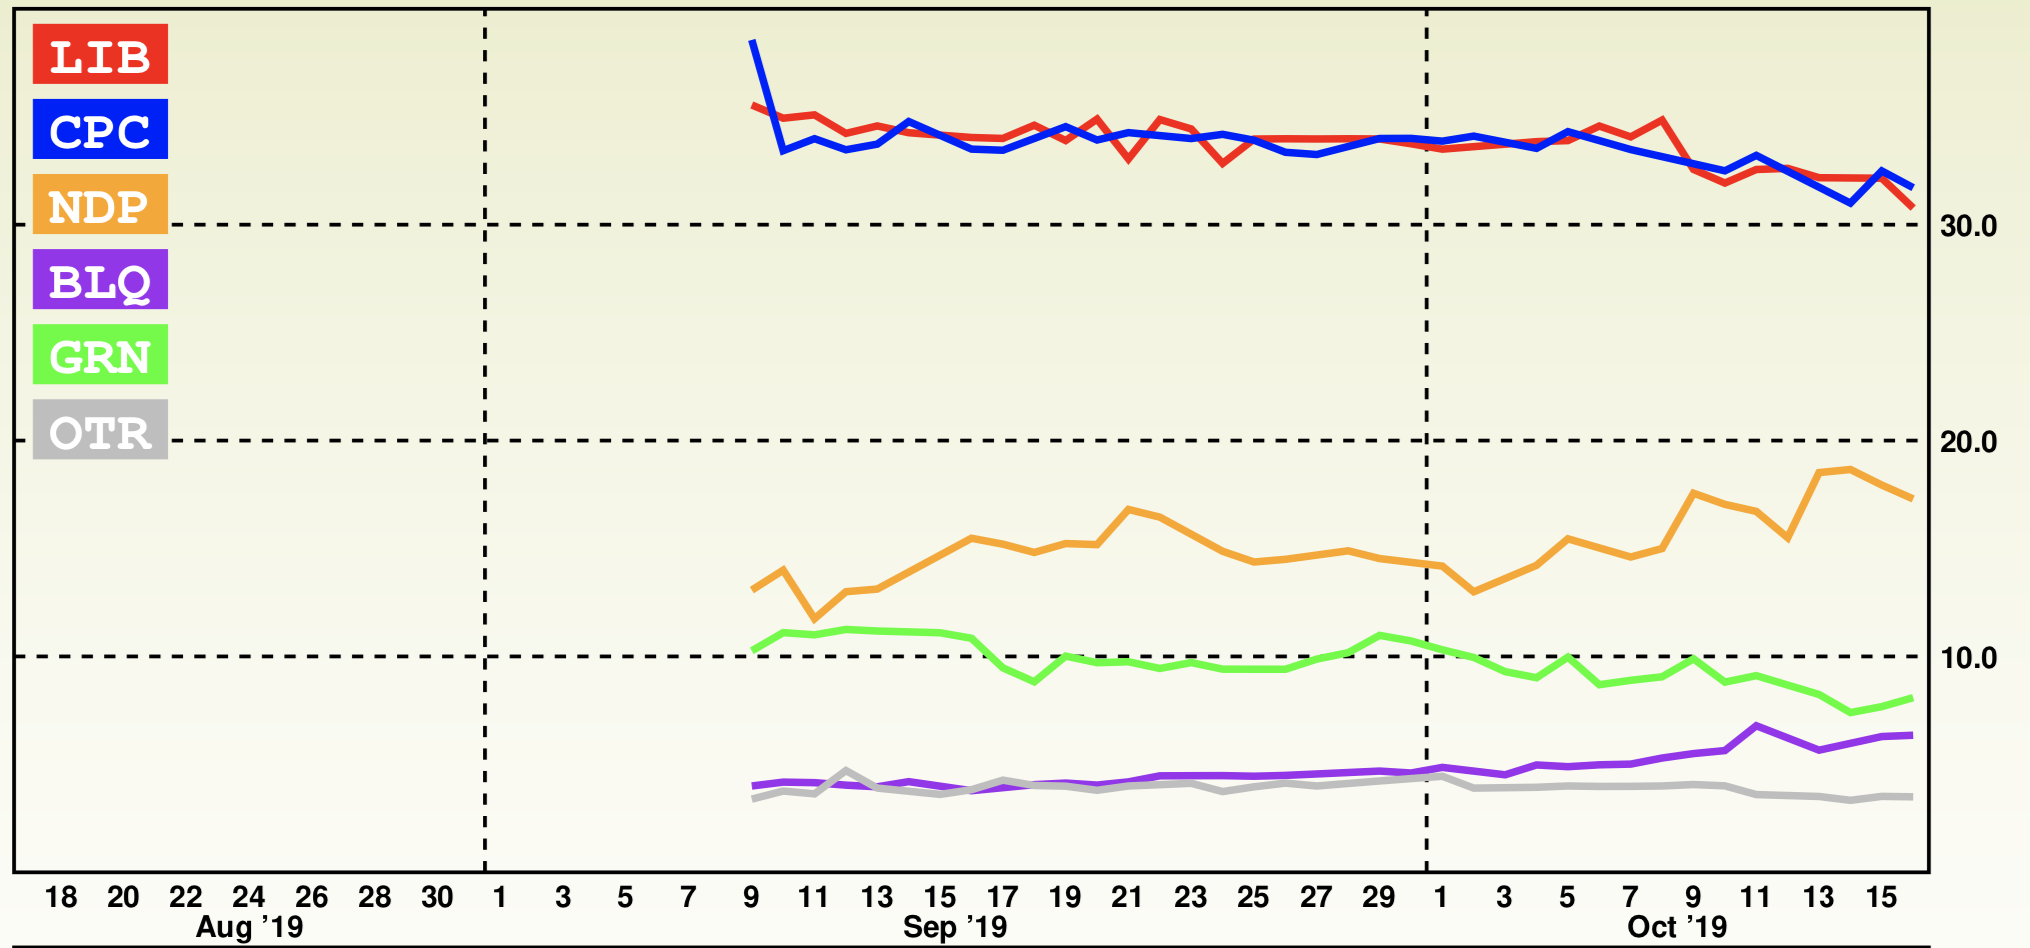
2019 context
The Conservatives will be looking to restore the historic pattern and win a plurality of seats, as they have consistently done over the years. The Liberals hope to make the 2015 election a new, sustained pattern.
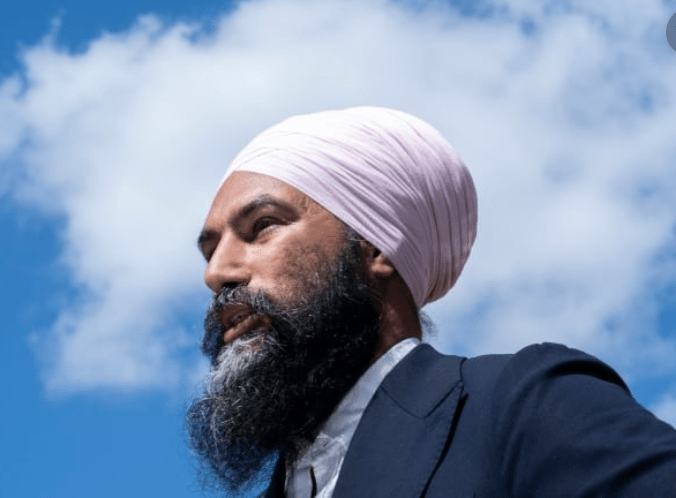
The NDP will be looking to BC for survival. With its gains in Quebec evaporating, the NDP is desperate to hold its remaining 28 seats in English Canada – half of which are in BC.
The Greens have an opportunity to grow their caucus from two to five or more on Vancouver Island. Just like the Nanaimo byelection, it requires traditional NDP voters – and Liberals – to move over to the Greens.
BC’s regional picture
While BC has 42 seats overall, the federal election will play out in four regions that have unique battlegrounds.
The Lower Mainland has a majority of seats and is multiculturally diverse. Within the Lower Mainland, there are key differences, similar to core Toronto seats and the 905. The urban core (Vancouver and adjacent communities) have different characteristics than the outer suburbs and Fraser Valley – different housing density, immigration patterns, and transportation habits, for example.
While both regions are more rural and less multicultural than the Lower Mainland, they have very different voting patterns. Vancouver Island leans granola and the Interior/North leans hardhat.
Vancouver Island
The Island’s seven seats may elect representatives from four separate parties. The NDP managed to win 6 of 7 Island seats with only 33% of the vote, a very efficient result, but one that puts them on the edge of major losses if they fall back in public support. The Greens proved this point in the Nanaimo-Ladysmith byelection, catapulting over the NDP to win their second seat.
| Table 2: Vancouver Island |
2015 Vote%
|
2015 Seats |
At dissolution |
Incumbents seeking re-election
|
| NDP |
33%
|
6 |
5 |
4
|
| Greens |
24%
|
1 |
2 |
2
|
| Liberals |
21%
|
0 |
0 |
0
|
| Conservative |
21%
|
0 |
0 |
0
|
Elizabeth May is the safest MP on the Island.
Jagmeet Singh is not well known on Vancouver Island and is under significant pressure to hold the NDP’s remaining five seats. The NDP held off a strong Green charge in Victoria in 2015 due to the strength and popularity of MP Murray Rankin. He’s not running again and his successor lacks his personal standing. Of the NDP’s four remaining ridings, the NDP won two of them with 35% of the vote and the other two with 38% to 40%. They are all vulnerable to a Green surge that could either overtake them or split the vote and elect a Conservative, or even a Liberal.
The Liberals are keying on Victoria, a seat that Liberal David Anderson held between 1993 and 2006, and look longingly at Esquimalt-Saanich-Sooke, which erstwhile Reform/Alliance MP Keith Martin won for the Grits in 2006. Anderson and Martin had strong personal brands so it remains to be seen if the Liberals can win with lesser-known candidates.
The Conservatives are likely pinning their hopes on Courtenay-Alberni and North Island-Powell River. These ridings are more resource dependent and less urban, and overlap with areas where the provincial BC Liberals are strongest. The Conservatives will be in the conversation in Nanaimo-Ladysmith, Cowichan-Malahat-Langford, and Esquimalt-Saanich-Sooke, where vote splits could deliver a Conservative win with 28%-30% of the vote.
Upshot:
A Green ‘breakthrough’ would be a minimum of 3 seats.
A ‘successful’ NDP salvage mission would be maintaining a minimum of 3 seats. Holding 5 seats would be a remarkable accomplishment considering the low expectations.
The Conservatives need a minimum of two gains to contribute to a winning plurality nationally.
The Liberals will be happy with one seat. The action is elsewhere for them.
Vancouver Core
Thirteen seats in the western portion of the Lower Mainland, around Vancouver’s urban core including the North Shore, Burnaby, and Richmond, strongly favoured the Liberals and punished the Conservatives in 2015.
| Table 3: Vancouver Core |
2015 Vote
|
2015 Seats |
At dissolution |
Incumbents seeking re-election
|
| Liberal |
44%
|
8 |
7 |
6
|
| CPC |
26%
|
1 |
1 |
1 |
| NDP |
24%
|
4 |
4 |
4 |
|
Green
|
5% |
0
|
0 |
0
|
The NDP won four seats in this area due to a concentration of vote in historically strong seats. The Greens are not a contender in any seats on BC’s mainland. If they get close anywhere, it would probably be West Vancouver-Sea to Sky-Sunshine Coast where they have some history of strong showings and the absence of an incumbent.
There is limited opportunity for the Conservatives to claw back seats in 2019 in this area, but Steveston-Richmond East will be highest on its list. It’s a rematch between the 2015 Liberal and Conservative candidates. Liberal MP Joe Peschisolido is a former Canadian Alliance MP and Reform Party candidate, a maverick, who has been an active campaigner in Richmond for almost twenty years.
The Conservative breakout opportunity would be winning Vancouver South and seats on the North Shore, but they have already punted their candidate from the winnable seat of Burnaby-North Vancouver, a costly loss where a smarter candidate strategy would have made a difference. In the blue target riding of Vancouver South, the Conservatives are running former MP Wai Young (Young ran a distant fourth. Her breakaway civic party clearly cost the centre-right NPA a majority on Council and was decisive in enabling former Burnaby South NDP MP Kennedy Stewart to win the mayoralty with only 28.7% of the vote. Interesting footnote is that Young’s party released a poll from Hamish Marshall’s firm in dying days of campaign that showed Young only three points behind the NPA mayoralty candidate and Kennedy Stewart 14 points in the lead. On election night, the NPA lost to Stewart by half a point while Young had less than 7% of the vote).
The Liberals are seeking to win Vancouver Kingsway from the NDP with well-known news anchor Tamara Taggart, but she needs national wind in her sails to knock off popular MP Don Davies.
NDP leader Jagmeet Singh hopes to retain his Burnaby South seat and would appear to be in good shape. Svend Robinson is campaigning hard in Burnaby-North Vancouver, however, with the demise of the Conservative candidate, it’s hard to see how he overcomes Terry Beech and the Liberals. There is no orange wave yet in Metro Vancouver to lift the boats of NDP candidates in Metro Vancouver.
Then there is Vancouver Granville. Independent Jody Wilson-Raybould hopes to make history by being the first indigenous women re-elected in BC and to pull off the rare feat of being elected as an independent and the first to do so in BC since Chuck Cadman in 2004. Last election JWR and the Liberals took 44% of the vote with the NDP and Conservatives taking 27% and 26% respectively. JWR will need to take many NDP (and Green votes), along with Liberals who stick with her. How many Liberals will stick by their brand? Can the Conservative make it to 30% and win on a split? At this point in the campaign, it looks like JWR may have the largest pool of potential votes.
Upshot:
Overall, this area looks fairly static.
There are not a lot of gains in this area for the Conservatives. To win a plurality of seats in Canada, they need to win seats like Steveston. To win a majority, they need to win seats like Vancouver South and the North Shore. Right now, it looks like two seats is a realistic goal.
The NDP hope to hold their four seats but do not have a very good opportunity to add others.
The Liberals should be in a position to hold at least 6 of the 8 they won in 2015.
Lower Mainland suburbs/Valley
Further from the Vancouver core, there are a baker’s dozen of suburban and Fraser Valley seats stretching east to the Fraser Canyon. There are a lot of commuters, an especially strong South Asian population, and traditional conservative farming areas. You could call it BC’s 905, to some degree.
The Liberals picked the Conservatives’ pocket in this region in 2015, winning unexpected seats in places like Langley, Abbotsford, and James Moore’s old seat in Coquitlam, while gaining a new dominance in Surrey.
| Table 4: Lower Mainland suburbs/Valley |
2015 Vote
|
2015 Seats |
At dissolution |
Incumbents seeking re-election
|
| Liberal |
40%
|
8 |
9 |
9
|
| CPC |
34%
|
4 |
2 |
2 |
| NDP |
21%
|
1 |
1 |
0 |
|
Green
|
4% |
0
|
0 |
0
|
The Conservatives used to ‘own’ Surrey so must claw their way back, but it won’t be easy. The Liberals took four seats handily in 2015. Sukh Dhaliwal’s Newton seat is a fortress, while Surrey-Centre, Fleetwood-Port Kells, and Cloverdale-Langley City were all won with healthy margins and over 45% of the vote. In 2015, Dianne Watts preserved South Surrey-White Rock for the Conservatives in the face of a red tide in Surrey, but in a 2017 byelection, the Liberals stole the riding, leaving the Conservatives with only one seat west of Langley. Now, the Liberals may hold South Surrey-White Rock because they have a candidate advantage, and withstand what should be a Conservative pick-up.
Of all the regions in BC, this is the one where the Conservatives need to make major gains. Liberal wins in Coquitlam-Port Coquitlam, Pitt Meadows-Maple Ridge, and Mission-Matsqui-Fraser Canyon were won with 33% to 37% of the vote and are at high risk. The Conservatives will also key on Delta, but incumbent Liberal cabinet minister Carla Qualtrough is popular. The Conservatives can count on three Fraser Valley seats between Langley Township and Chilliwack. Long-time MP Mark Warawa passed away recently leaving a vacancy, however, the Conservatives should have little difficulty winning the seat.
The NDP’s only MP in this region, Fin Donnelly, is retiring, opening up a three-way fight in Port Moody-Coquitlam. This will be a tough one for the NDP to hold. The Liberals and Conservatives both have an opportunity to win a new seat.
Upshot:
This will be the region to watch. It could go 7-6 or it could go 10-3 either way, and have a major impact on national seat totals. If Andrew Scheer becomes prime minister, he will have made major gains here.
The Liberals have very little history of winning seats in this region Taking even half of the seats would represent a sustained shift in BC’s federal voting patterns. Winning 4 or 5 out of 5 seats in Surrey would provide the Liberals with an ongoing power base that complements its traditional base in Vancouver.
As for the NDP, they have historically won seats in Surrey and northeast suburbs, but have been eclipsed by the Liberals. They have not yet demonstrated they have the formula to flip the dynamic and may well be shut-out here on election night.
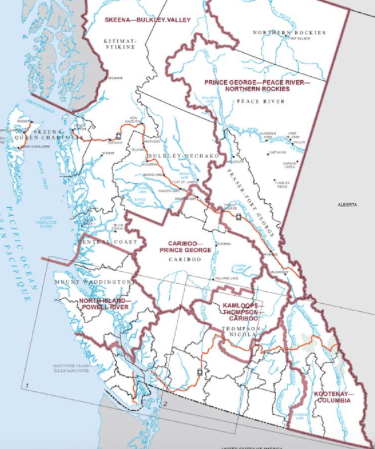
Interior and North
BC’s Interior and North holds nine of BC’s forty-two seats. This is an area where Conservatives should make their easiest gains, at the expense of the struggling NDP, and another potential pickup from the Liberals in Kelowna.
| Table 5: Interior/North |
2015 Vote
|
2015 Seats |
At dissolution |
Incumbents seeking re-election
|
| CPC |
37%
|
5 |
5 |
5
|
| Liberal |
30%
|
1 |
1 |
1 |
| NDP |
28%
|
3 |
3 |
2 |
|
Green
|
4% |
0
|
0 |
0
|
Until they won in Kelowna in 2015, the Liberals had not held a seat in the Interior since 1979. BC’s Interior cities have gradually become more urbanized with stronger university presence over the years in Kelowna, Kamloops, and Prince George. A Liberal win in 2019 would make a turning point, and they hope to do the same in Kamloops with star candidate Terry Lake, a former BC health minister.
NDP seats in the South Okanagan and East Kootenay are very vulnerable. High profile NDP MP Nathan Cullen is retiring in Skeena-Bulkley Valley. However, this is a riding with different politics than the rest of the Interior and North – perhaps belonging with Vancouver Island region, and will likely stand as the lone NDP seat ‘beyond Hope’.
Upshot:
It should be a major disappointment for Conservatives if they do not take 8 of 9 seats in BC’s Interior. Given their struggles to make gains in urban Canada, they must clean up outside the major cities.
The Liberals hope to maintain its Interior beachhead in Kelowna. While they are making a spirited charge in Kamloops, a win there would be political gravy. The Interior is not a region that is critical to win in order for the Liberals to hold power.
NDP disaster would be losing Skeena-Bulkley Valley. A key part of holding that seat is the First Nations vote, where it is one of the highest in Canada (I’ll look at First Nations vote in more detail in another post). Holding its two southern Interior seats looks unlikely in the face of a Conservative challenge combined with a new leader that is struggling to make his impact in BC.
Provincial wrap-up
National momentum can make a big difference in BC where three and four-way fights may send an MP to Ottawa with 30% of the vote. Certainly, BC is a region where the Conservatives have a significant opportunity. If they are able to reach north of 35% of the vote and have more than a 5% lead over the Liberals, they could win a majority of BC’s seats.
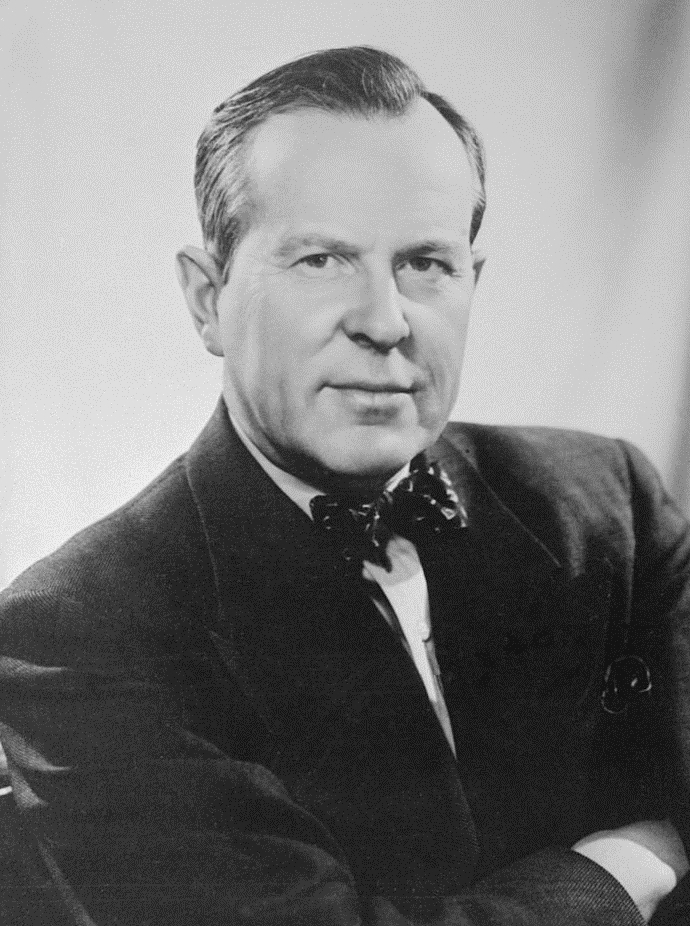
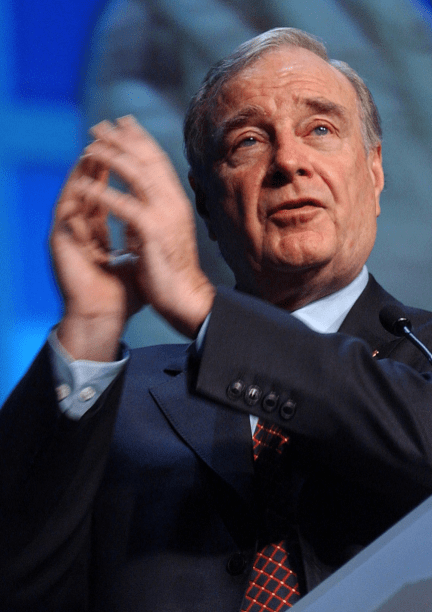
It’s fair to say the Liberals have a candidate advantage this election. Almost all of their incumbents are running and they are strongly contesting what they feel are winnable seats. The Conservatives squandered Burnaby-North Vancouver and, overall, their BC team lacks recognizable figures. Both parties can look back to 2004 when the Paul Martin Liberals, and BC master strategist Mark Marissen, put a lot of focus on gaining seats in BC, recruiting Ujjal Dosanjh and David Emerson, and issuing a ‘made in BC’ agenda. That extended to the 2006 election when the Conservatives won the federal election, but paradoxically lost some ground in BC. It takes commitment and support from party leadership to recruit candidates and strengthen the ground game.
As outlined in an earlier post, the Conservative pathway to power depends on winning in the neighbourhood of 75% of the seats in Western Canada. While Alberta and Saskatchewan are looking very good for Andrew Scheer, winning at least half of BC’s 42 seats will be a necessity.
As of today, the Conservatives are poised to make some gains, nibbling away at seats in the Interior and possibly on the Island. The big question mark is whether the Conservatives can challenge the Liberals’ strong position in the Lower Mainland.
We can expect to see four parties, and quite possibly an independent, win on election night. We can also expect to see BC play an important role in shaping the next government.
As of today, expect the parties to be in the following range:
| Table 6: Party ranges |
Island (7) |
Vancouver core (13) |
L.M. suburbs / Valley (13) |
Interior / North (9) |
| Liberal |
0-2 |
6-10 |
3-10 |
0-2 |
| CPC |
0-4 |
0-5 |
3-10 |
5-9 |
| NDP |
0-6 |
3-5 |
0-3 |
0-3 |
| Green |
1-5 |
0 |
0 |
0 |
| Independent |
|
0-1 |
|
|
My general range estimates provide a universe of 24 seats of the Liberals, 28 for the Conservatives, 17 for the NDP, 5 for the Greens, and 1 for JWR. Conversely, the floor for parties in BC looks to be 9 for the Liberals, 8 for the Conservatives, 3 for the NDP, and 1 for the Greens. So, that’s a range of 21 (low) to 75 (high) seats across the party universes. Obviously, I’m hedging with two weeks to go, but in BC, it’s wise to hedge. Given the nature of this campaign, a soft breeze one way or another may tilt three and four way races into the lap of our next prime minister, or into the lap of a leader – Mr. Singh or Ms. May – who will decide who is the next prime minister. They both represent BC ridings – if BC doesn’t ‘elect’ a majority government at the polls, a BC leader will likely help ‘elect’ a new government at Rideau Hall or in the House of Commons.
49.265488
-123.136741


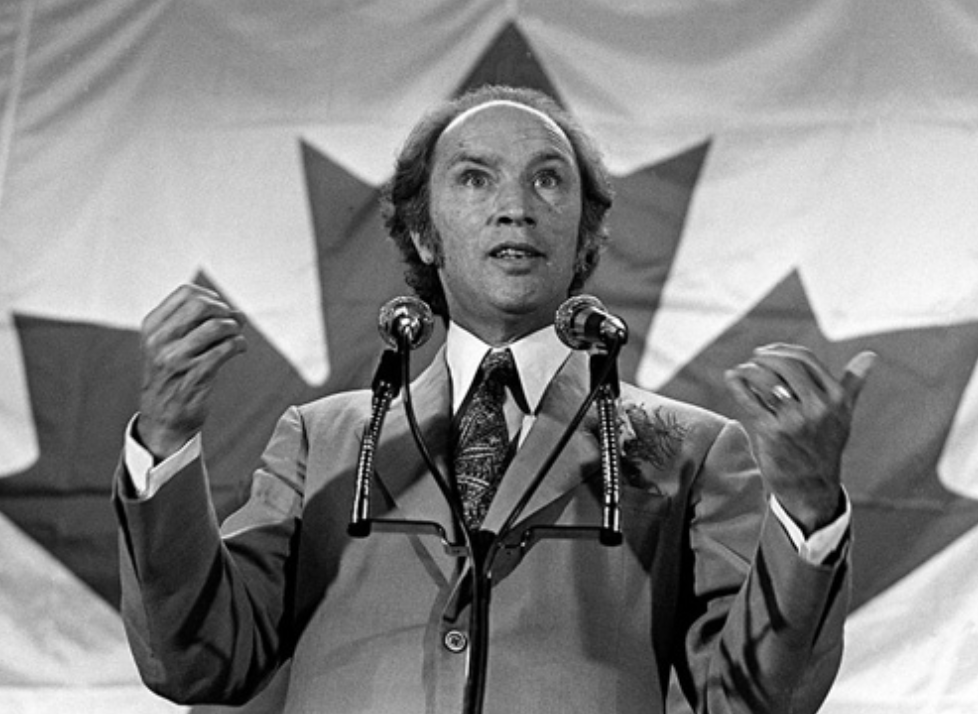
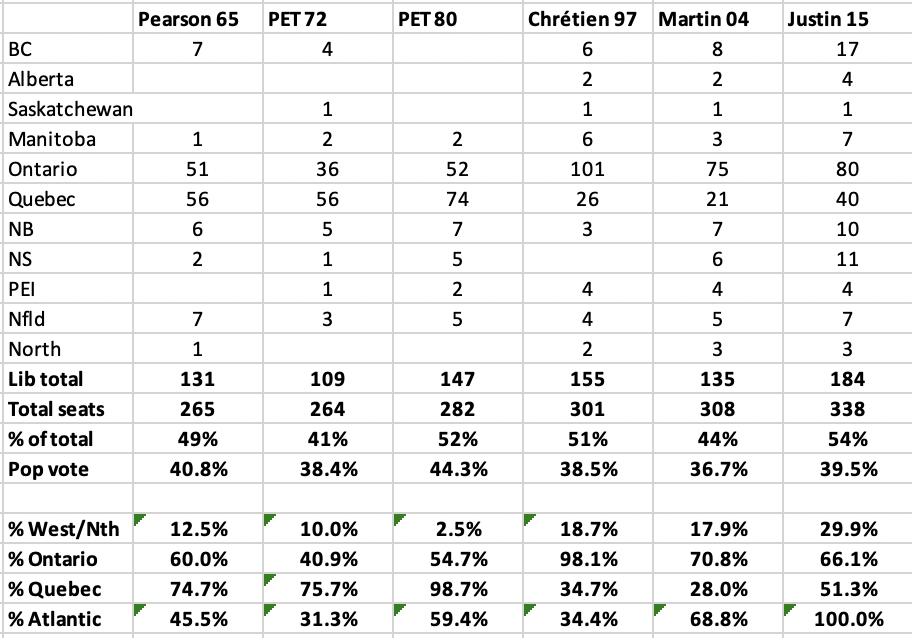
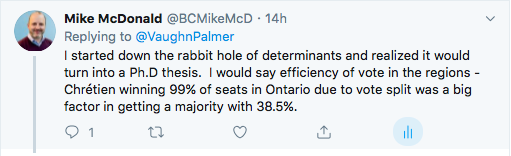
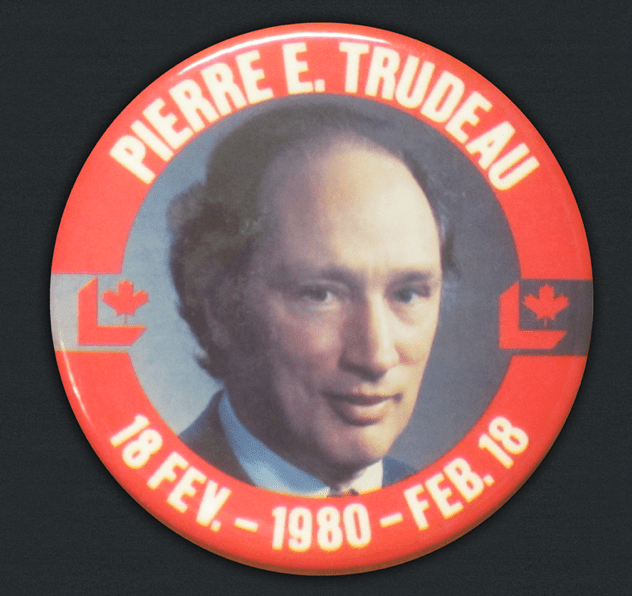 In his fifth and final election campaign, Pierre Trudeau drove the Central Canadian Special right down the gut of Canada’s electoral map, winning a majority with 147 of 282 seats (52%). He took 99% of the seats in Québec and a majority of seats (55%) in Ontario. He had a little help from the Atlantic too, where he had a better result (59%) than the previous two examples. In the west, the Liberals were virtually extinguished, winning two seats in Manitoba. Nuttin’ in BC, Alberta, or Saskatchewan. Blanked in the North as well.

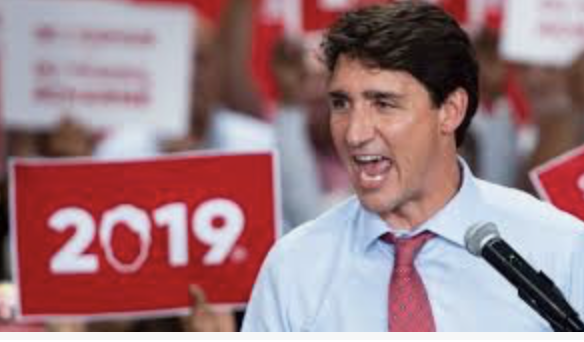 The examples discussed demonstrate that you can win by utterly dominating a large region, as PET did in 1980 and Chrétien did in 1993, 1997, and 2000. However, if there’s not domination, there must be some regional balance. Justin Trudeau’s pathway is regional balance.