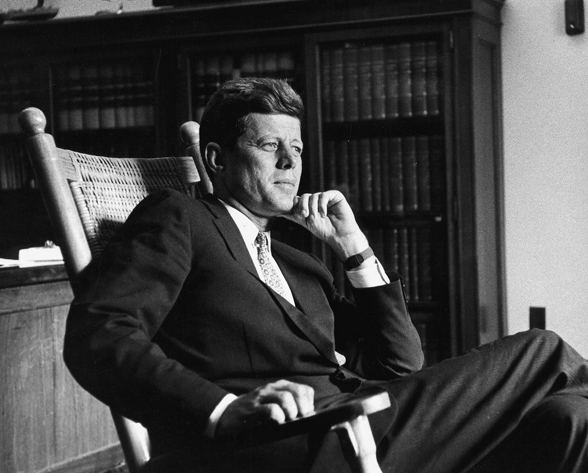
I recently had the opportunity to visit the John F. Kennedy Presidential Library in Boston. A must-see for any political junkie. Amidst the exhibits on the 1960 presidential campaign, there was an electoral map of the results. The differences were striking. Many states that were red in 1960 are blue today; and vice versa. As the presidential candidates debate tonight, they will be facing a very different political map than the one that occupied the minds of JFK and Richard Nixon 56 years ago.
- California was Nixon’s in 1960. Unfathomable as Republican today.
- Texas was with JFK and LBJ all the way. Strongly Republican now for many years.
- The Deep South was won by the ‘Dixiecrats’, but the fault lines had emerged.
JFK’s political math followed much different geography than Hillary Clinton’s
I count 23 states that switched colours between that election in 1960 and the most recent election in 2012, which encompassed a majority of the electoral college votes.
The Democrats in 1960 were shaking off segregationist voters, or rather, the segregationists were shaking off them. George Wallace would emerge in the 1960s as a regional force, breaking the bonds of Southerners to the Democratic Party (and many would become Reagan Democrats in the 1980s).
The Republicans of 1960 had moderating influences. They wore the mantle of Lincoln while having a sizeable following of Rockefeller Republicans, expressing an east coast, urban sensibility. Nixon, himself, had a decent civil rights record. They carried states like Vermont long before Bernie Sanders showed up.
Coalitions change over time. One might think the party of Kennedy and the party of Obama would follow similar patterns, but they found very different routes to power. No different in Canada where national parties have re-invented themselves as they have won and lost in regions over the years. Justin Trudeau forged a new regional coalition in 2015 that had been unattainable for Liberals for many decades. Brian Mulroney had built a “Quebec-Alberta” bridge in 1984 and 1988 that had seemed so tantalizingly close for Thomas Mulcair and the NDP.
In 2016, Donald Trump’s appeal to working-class white voters has threatened to destabilize Democratic states like Michigan and Pennsylvania, and make the difference in Ohio and Florida, while some have speculated that Hillary Clinton could reclaim a southern state or two. A key difference between 1960 and 2016 is that JFK and Nixon had a very wide battleground. The two largest states – California and Texas – went down to the wire. Famously, Illinois went Democrat by 9,000 votes, whether those votes were real, or imagined by the Cook County Daley machine. The political map in the US is more polarized now.
Figure 1: 1960 Electoral Map

The 1960 campaign was virtually tied – JFK with 49.72% and Nixon with 49.55% – and there was no room for third party candidates. The electoral college was not as close: 303 for JFK and 219 for Nixon. (The other 16 electoral college votes were unpledged delegates in Mississippi and Alabama who ultimately voted for segregationist Senator Harry Byrd as president, even though he did not seek election).
The Republicans were strong in the west and midwest, extending through the middle of the country to Virginia, but for Illinois and Missouri. They added three New England states and Florida. The Democrats mainly had Texas and the South, Missouri, Great Lake states of Minnesota, Illinois, and Michigan, and populous east coast states like Massachusetts, New York, New Jersey, and Pennsylvania.
Figure 2: 2012 Electoral Map

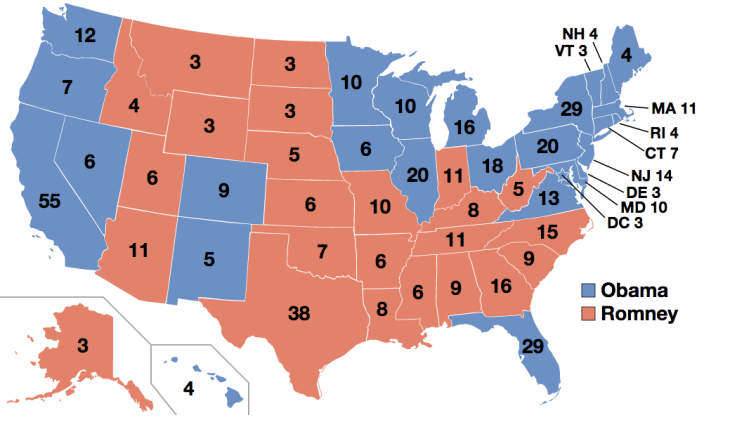
By 2012, the map had changed. A majority of electoral college votes (302) changed hands between those two elections. With California and Texas switching sides, that’s a change of 93 votes (2012) right there.
In the South in 2012, from Texas to South Carolina, the Republicans picked up 118 electoral college votes whereas they had none in 1960. But they lost 74 votes on the western seaboard, and 47 between Ohio and Florida for a net loss of 121.
Table 1: State-by-State results, winning presidential campaigns in 1960 and 2012 (switching states in yellow)

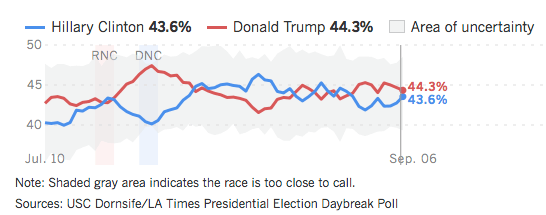
Real Clear Politics calculated that the average of current polling estimates (as of September 26th) has the 2016 electoral college at 272 Clinton, 266 Trump. Rival strategists will be poring over the map to identify how they can remake it, as history shows it won’t necessarily stay the same.