FPTP vs. PR – and the winner is?

If this was a conventional election, it would appear First-Past-the-Post (FPTP) will prevail over Proportional Representation (PR).  Is it a conventional election? Let’s take a look.

electoral-reform-envelopes.jpg

It’s all over but the counting. (photo: Times Colonist)

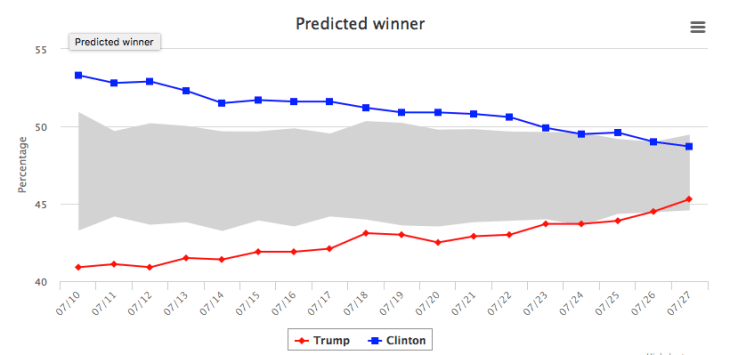
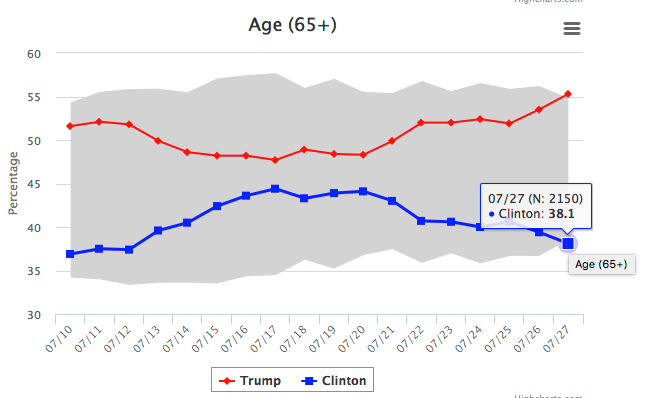
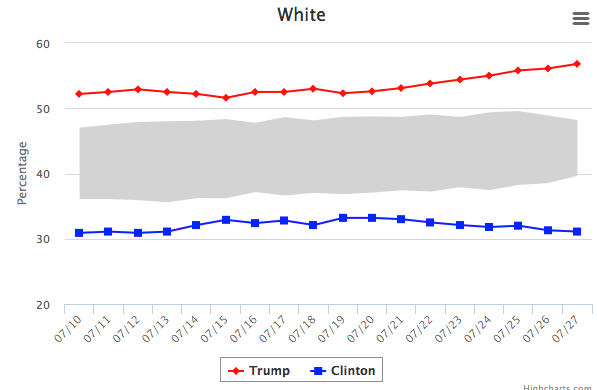
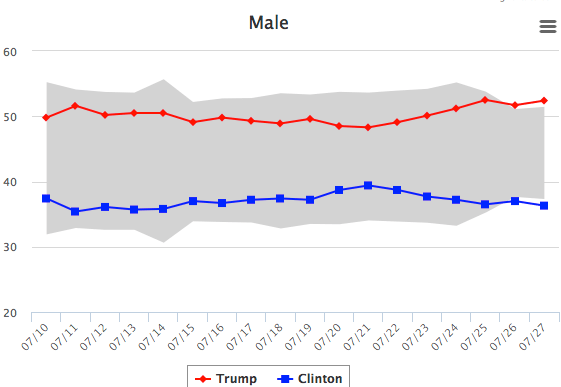
It appears, according to public polls, that it’s a competitive race between the two options. Various polls have it in the 50-50 range.  There is also a consensus among public polls that PR is strongly favoured among young people and FPTP is strongly favoured among older people.

There are regional variations.  Areas where PR appears strong are Vancouver Island (where the Greens are strongest) and the City of Vancouver. FPTP appears strongest in BC’s Interior.

Ethnicity and language also appear to play a role.  Public polls do not show breakdowns by ethnicity (and I wonder if they are properly represented in sampling), but we can see that turnout has been lower in ridings that have lower English-first language populations, such as Richmond and Surrey.

There has been some interesting analysis conducted by Star Metro reporter David Ball and Langara College professor Bryan Breguet (an unabashed PR supporter) who has a blog called “Too Close to Call”.

Ball tracked the rate-of-return of the mail-in-ballots and compared it to the HST and Translink referendums.  The seemingly slow rate of response at the outset of the process was typical of these processes.

_2_bcballots_dec6_davidpball.jpg

Brequet ran regressions and other analysis to determine who might be voting.  He’s also conducted Google polls, that show the race very tight.  I’m a bit more primitive in my approach so take the following as you will.

Here’s what we know:

1,361,000 ballots were received, and Elections BC has published the riding-by-riding totals for over 92% of those ballots, providing a fairly clear picture of the regional breakdowns.

Turnout

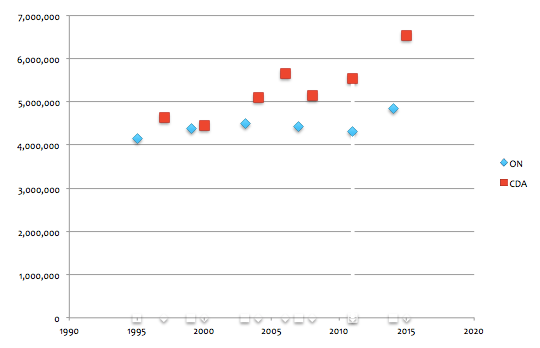
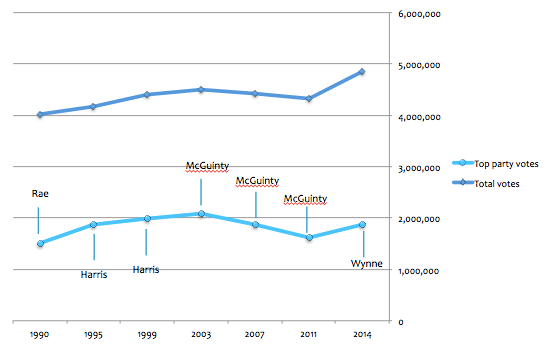
On the spectrum of turnout for province-wide votes over the past seven years, the PR referendum was low.  Take into account population growth and the PR turnout was even weaker when compared to the HST referendum.

Screen Shot 2018-12-13 at 10.08.38 AM.png

Regional Differences

One of the wrinkles with looking at these results by region is to look at raw votes rather than ridings.  There are 24 seats in the Interior and only 15 on the Island/Sunshine Coast.  Yet the average riding population on the Coast is higher.  In the final analysis, there are about as many votes from the Island/Sunshine Coast as there are from the Interior.

The Interior received ballots earlier, and returned them earlier.  Over the course of the balloting period, the Interior’s share of the overall pile of votes diminished to about its share of registered voters.  The FPTP advocates may have hoped that the Interior would punch above its weight in terms of turnout.  The region that did over-perform its share of the electoral pie was Vancouver Island / Sunshine Coast.  By the time the final 8% of ballots are allocated to ridings, the Island will likely surpass the Interior in terms of overall votes, and will have over 20% more influence on the process than compared to its share of registered voters.  The Lower Mainland will have about 8% less influence on the process that its share of registered votes.

Screen Shot 2018-12-13 at 10.15.43 AM.png

Partisan Differences

We can also track where the votes came by held-seat.  In the HST referendum, every NDP seat voted against the HST, while half of the BC Liberal seats voted for the HST.  Who represents a seat can be an indicator of support – not because of the MLA, but because of the underlying attitudes that got that party and MLA elected in the first place.  One could reasonably assume that BC Liberal seats will lean FPTP and NDP/Green seats will lean PR.  That will probably be the case writ-large, though there will be exceptions.  (For the purposes of this analysis, I am basing it on held seats as of election night, 2017).

Screen Shot 2018-12-13 at 10.17.44 AM.png

What does this tell us?  The three Green seats over-performed on turnout, while the NDP under-performed.  NDP held-seats in Surrey, for example, had very low voter turnout.  Apparently, voters in Cowichan, Oak Bay, and, Saanich North & the Islands were more eager to receive their ballots than to have a visit from Santa.  But there may be other reasons for that, stay tuned (see below).  The BC Liberal seats held their own, but no advantage in turnout.  Again, those 20 of 24 seats in the Interior held by the BC Liberals did not generate as much in terms of turnout percentage as I would have thought.

In the Lower Mainland, it was very close in terms of raw vote turnout between the NDP-held seats and the BC Liberal-held seats.  The NDP’s 26 Lower Mainland seats account for about 50.5% of all votes in the Lower Mainland processed already versus 49.5% for the 22 BC Liberal-held seats.  There are no Green seats in the Lower Mainland.  So, in the Lower Mainland, the BC Liberal seats did better relative to the NDP.

In the Lower Mainland, the turnout was highest in Vancouver-North Shore and the Fraser Valley, relative to Burnaby to Mission corridor and Richmond to Surrey corridor.

Older people vote

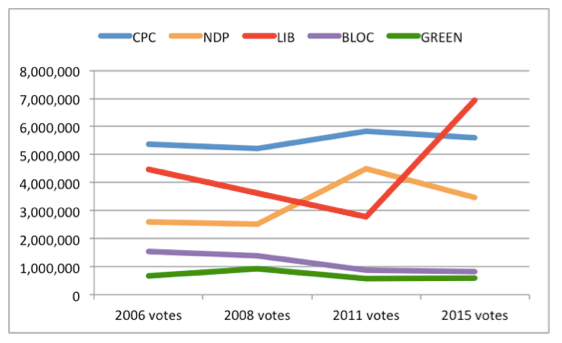
It is a consistent truth in Canadian elections that turnout is higher among older people than younger people.  In the 2015 federal election, there was a bigger turnout among all age groups, but the old geezers still outpaced the Millennials.

Let’s look at turnout-by-age in the 2017 provincial general election.  Work with me here.

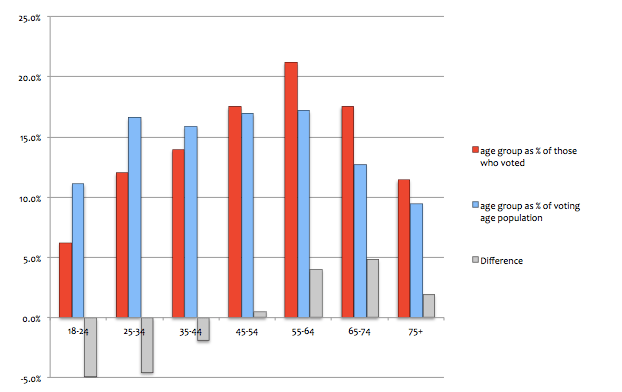
The 18-24s represent 11.1% of the eligible voters (the red bar).  However, they represented only 6.3% of those who actually voted (the blue bar).  Meanwhile, the 65-74s are busy voting on the first day of the advance polls following their coffee and muffin at Tim Horton’s.  This group represents 12.7% of eligible voters (red), but 17.6% of those who voted (blue).  There are only about 10% more 65-74s than 18-24s in terms of eligible voters, but almost a 3X difference between them in terms of who voted.

Chart 1: Turnout by Age, 2017 BC provincial election (source: Elections BC)

Screen Shot 2018-12-13 at 9.28.36 AM.png

So, the question is, given that public polls indicate a strong preference among seniors for FPTP, did old voters rule the roost in the PR referendum too?

Bryan Brequet from Too Close to Call has undertaken some analysis and he sees a trend toward more younger voters.  I think what he means is that the gap between younger and older voters in the PR referendum may not be as pronounced as the 2017 general election.

I’m not so sure.  When you have a lower turnout, the age discrepancy is usually bigger.  When you have a higher turnout, more younger people (and other less-likely voters) are showing up to the polls.

So here’s what I did…

I ranked the ridings 1-87 in terms of turnout in the PR referendum.  Parksville-Qualicum is #1, at 46% turnout. Surrey Whalley is #87, at 18%.  (This is, as of, 92% of ballots being screened.  Turnout by riding will increase but the ranking of ridings 1-87 will probably not change that much).

Then I took BC Stats data and looked at the 18-44 population per riding.  I ranked the ridings 1-87 in terms of their proportion of 18-44s relative to the overall adult population of the riding.

The green shading indicates the ridings that are in the lowest quartile of 18-44s (the oldest) ,and the red shading indicates ridings that are in the top quartile of 18-44s (the youngest).

What did I find?  The top 8 ridings in terms of voter turnout in this referendum are also in the oldest quartile when it comes to age by population.  Six of the 8 lowest turnout ridings are in the youngest quartile.  In fact, as you go down the list from highest turnout to lowest turnout, you will see 19 oldest-quartile ridings before you hit the first youngest-quartile riding.

The Rosedeer Decision Desk calls it:  Older people vote more.

Screen Shot 2018-12-12 at 3.12.17 PM.png

Older People vote more … but what does that mean?

If I’m right, and a similar pattern exists in this referendum as it does in most general elections, then it’s good news for FPTP.  But there are definitely some mixed messages.

One of the oldest ridings is Saanich North & the Islands represented by the Greens.  Will older people deliver this riding for FPTP or will the Greens deliver it for PR?  I think it’s both.  I’m sure the Greens will have worked hard to deliver votes there (they get elected there for a reason), but age will be a bit of a mitigating factor.  This could be the story of the Island – an inexorable pull to PR by the Greens (and to a lesser extent, the NDP), restrained by a sizeable population of old geezers.

In older, BC Liberal-held Lower Mainland ridings like Delta South, West Vancouver-Capilano and White Rock, you might see some of the largest margins for FPTP.

Even if there are more older people voting than younger people voting, the question is, where is support at for FPTP and PR?

If it is 50-50 in the polls, and if public polls are correct in so much as older people favour FPTP and younger people favour PR, and IF an age turnout factor is present is as above, then 50-50 becomes 47-53 or even 45-55 in favour of FPTP.

However, if PR has burst through, and if it has weakened opposition among older people down the home stretch, and made a breakthrough with 35-54s, then overall support of 55% among eligible voters may translate to just enough (50% +1) among those who actually voted.

Language

As mentioned, some of the Lower Mainland ridings have the lowest turnout of any seats in the province. The Lower Mainland also has the highest share of non-English (first-language) households in the province as well.

Similar to age, there is a correlation between turnout and English-language skills.  This table, like the previous, is ranked by turnout. The green shading indicates ridings in the lowest quartile when it comes to non-English households.  The red shading indicates ridings in the highest quartile of non-English households.

What does this tell us? We can hypothesize that election materials were not accessible to some voters, or was not debated as extensively in their language (via media) compared to English-speaking media.  Unlike turnout-by-age data supplied by Elections BC, we do not have comparable data for ethnicity or language.  I can merely point out the correlation.  Anecdotally, the HST referendum appeared to have had a high level of engagement in the Chinese community, owing in part to mobilization of Chinese restaurateurs who opposed the tax.  It’s fair to say, I think, that the PR referendum did not hold the attention of the Chinese media (or Punjabi media) like the HST issue.

Screen Shot 2018-12-12 at 3.14.51 PM.png

While Chinese voters tend to favour the BC Liberals, historically, and voters from Punjabi-speaking households have leaned more to the NDP over time, the Greens are clearly weaker in these communities relative to support they have elsewhere.  Therefore, one could argue that lower turnout in parts of Surrey, Richmond, and other Lower Mainland areas might be good news for PR, if you think you are more likely to find PR voters where the Green Party finds more fertile territory, generally.

The Upshot?

The voting is done.  I made my case for FPTP (“I was a Teenage Vote Splitter“) and have also pointed out how PR advocates should be careful what they are wishing for.

I think the final result will be close.  I think there was momentum toward PR in the final weeks which helped close a (perceived) gap.  For PR to win, it will have had to have done quite well with 35-54s (assuming young and old cancel each other), and have won the Lower Mainland (assuming Island and Interior cancel each other).

If PR does win, then it will have likely done so with less than 22 to 23% of registered voters.  We can debate the legitimacy of that if it happens.  Gordon Campbell had set a 60% threshold which seemed to be a reasonable threshold for a fundamental change to the electoral system.  The current government obviously thinks otherwise!

I do not think 42% turnout is enough for PR to win with a majority.  I think they needed more voters to flood the polls.  I expect FPTP to win by a few whiskers, a few grey whiskers.  We will know soon enough.

Merry Christmas and Happy Holidays to PR and FPTP supporters alike !

Voter Turnout lessons and what it means for Ontario

Update: My editorial in the Globe & Mail (June 6, 2018)

Ontario voters will render their verdict on June 7th.

It’s a very significant election.  The Liberals have governed since 2003.  A change in Ontario – either to Doug Ford’s PCs or Andrea Horwath’s NDP – will be a major tone-setter for national politics and influence the make up of the issues heading into the 2019 federal election, not to mention the impact it would have on one of the largest sub-national economies in the world.

But of course, only those who actually vote get to decide.  Millions of Ontario residents will avoid the polls altogether.

Screen Shot 2018-05-26 at 9.16.04 AM.png

Who will end up voting to elect the next Premier of Ontario? (Photo: CBC)

The recent BC election and 2015 federal election provide insight into who will show up to the polls in Ontario, and what it means for parties when the overall voter pool grows, and by how much.

You can’t stand still while the voter pool grows

Like the Ontario Liberals, the BC Liberals won four consecutive elections in BC – and like the Ontario Liberals – a female leader replaced a three-term Premier and won an improbable fourth term for her party.

In the case of BC, Christy Clark succeeded in holding her Party’s overall raw vote and its market share, especially in relation to the BC NDP, and won a majority in 2013.  In 2017, Clark’s BC Liberals still held their raw vote (almost identically), but the voter pool grew resulting in a loss of market share.  The Greens surged and the NDP bridged the gap.  Result: a minority government and we all know how that turned out.

Chart 1:  Raw vote for BC parties (1996-2017)

Screen Shot 2018-05-24 at 9.52.49 PM.png

In fact, when looking at BC’s historic forces of “Free Enterprise” versus “The Left”, the change over time is quite dramatic.  Free Enterprise has been sitting at around 800,000 voters for 20 years while the NDP/Greens have nearly doubled.  It finally caught up to “Free Enterprise” in 2017.

Chart 2:   Raw vote for Free Enterprise (BC Libs/Right wing parties) vs. NDP/Greens (1996-2017)

Screen Shot 2018-05-24 at 9.59.07 PM.png

The number of voters in BC provincial elections has climbed steadily since 2009 after a dip, with the total now reaching close to two million. Federal turnout was not that much different than provincial turnout from 2000 to 2011, but exploded in 2015.  Close to 2.4 million British Columbians voted, 20% more than the 2017 BC election.

Chart 3: Total number of voters in British Columbia in recent provincial and federal elections (BC only)

Screen Shot 2018-05-24 at 10.03.01 PM.png

The federal Conservatives – like the BC Liberals in 2017 – held their raw vote in 2015, but lost market share because almost three million more Canadians cast ballots in 2015 compared to the previous election. The Conservatives were happy with their slice of the pie in 2011, but Justin Trudeau helped bake a bigger pie leaving the Conservatives with their same old slice.  The Liberals were clearly the beneficiary of the increased turnout.

Chart 4: Federal parties’ raw vote totals (2006-2015)

Screen Shot 2018-05-24 at 10.07.20 PM.png

It also matters where you hold your vote.  Both the Clark BC Liberals and Harper Conservatives actually increased their raw vote in their heartland.  The BC Liberals cleaned up in the Interior while the Conservatives thumped the other parties in Alberta (and gained votes in Quebec).  But they both lost ground in the vote-rich urban regions.

A study of federal voter turnout among registered voters between 2011 and 2015 showed that there was increased turnout in all age groups, but the largest increase was among younger voters.

Chart 5: Turnout rate of registered voters by age group (2011 and 2015 federal elections)

Screen Shot 2018-05-24 at 10.12.16 PM.png

So, increased voter turnout, means more young people voting, meaning bad news for centre-right parties.  Got it?

Actually, it’s a bit more complicated than that.

Federal turnout in 2015 was quite exceptional.  It blew the lid off of previous federal elections and, as shown above, the 2017 BC election did not replicate that level of turnout.  Turnout increased, but it wasn’t “Justin-sized”.

In BC, the Golden Agers still rule the roost.  Those aged 55 to 74 punch above their weight.  Compared to their share of the population, those age groups make up a much bigger share of the voter pool.  The 55-64 age group makes up about 17% of the adult population but accounts for about 21% of the voters; the 65-74 age group makes up about 13% of the population but 18% of the voters. Combined, about 30% of the population have close to 40% of the voting strength.  Add the over 75s, who also have a disproportionately large share of voting strength, and you have half of the voting population over the age of 55.

The reverse is true, obviously, for younger voters, particularly those under 35.  Those voters make up about 28% of the population but only about 18% of the voters in BC.

Chart 6: BC age groups as a percentage of the population and as a percentage of voters

Screen Shot 2018-05-24 at 10.19.32 PM.png

When looking at how age groups compared between the 2013 and 2017 provincial elections, there are interesting findings.  The largest increase by age group was the 65-74s with over 60,000 more voters in that category in 2017.  The next largest increase was 25-34s at close to 40,000.  What explains this?  Demographics partly, but there may be a mini-Justin effect with the Greens inducing turnout (a theory, not proven) and it may have been a result of third-party turnout activism (again, not proven).  These numbers are also the result of Elections BC estimate so we also have to assume they got it right, but it rings true to me. (Not sure what’s going on with that 45-54 category – did I remember to vote?)

Chart 7: Increase in votes by age category between 2013 and 2017 BC elections

Screen Shot 2018-05-24 at 10.25.27 PM.png

Was the increase in 25-34s concentrated in the Lower Mainland where the BC Liberals suffered heavy losses? I don’t know.  It would be an interesting study to see where in BC the largest increases took place.

The increase in 65-74s – and indeed increases across the board among 55+ age groups, should have been a good thing for the BC Liberals.  The fact is – they didn’t do as well as 2013 with their base.  It wasn’t just young people showing up that made a difference; it was a lack of performance among previous BC Liberal voters.

What does this mean for Ontario?

Let’s take a look at how Ontario provincial elections compare to federal elections when it comes to turnout.

Federal turnout has been consistently higher.   In 2015, 6.5 million Ontario voters galloped to the polls to vote in the federal election, yet no Ontario provincial election has ever seen more than five million voters.

Chart 8: Comparison of number of Ontario voters voting in recent federal and Ontario elections

Screen Shot 2018-05-24 at 10.34.21 PM.png

Historical election data in Ontario shows us that – only once – has a political party received over two million votes (Premier Dalton McGuinty’s Liberals in 2003)

Chart 9: Ontario elections since 1990 – total votes and top party votes

Screen Shot 2018-05-24 at 10.42.03 PM.png

Taking turnout into account relative to federal elections, how many voters can we expect in the June 2018 election in Ontario?  And how many votes will the top party need?

The 2014 election saw provincial turnout at 88% of the level of the dull 2011 federal election.  If the 2018 Ontario election is 88% of the sizzling 2015 federal election, then that would equate to 5.7 million voters in June. That would be a huge increase. I don’t think that’s going to happen.  I think, like BC, there will be an increase in the voter pool – over 5 million for the first time – but probably not as high as 5.7 million.  Even with an increase north of five million, the winning party will likely need a record-setting vote total (+two million) or hope for a good vote split.

Then, who votes?

It is more likely that Ontario’s age composition will resemble BC’s 2017 profile than Canada’s 2015 profile – older people having a disproportionate share.

I looked at the share of each age group in the 2011 and 2015 federal elections, and the BC 2017 election, and applied those ratios to Ontario’s population.  Based on these three scenarios, 55+ age group would account for 42% to 48% of the voters in the coming election, compared to 38% share of the population.

Chart 10: Ontario population by age group compared to age models from 2011 and 2015 federal elections, and 2017 BC election

Screen Shot 2018-05-24 at 10.47.05 PM.png

Does it matter in Ontario?  Typically, the 55+ age group leans right relative to younger voters.  This was certainly the case federally in 2015 and in BC in 2017.

However, in Pollara Strategic Insight’s mid-election survey of Ontario voters, we found that the NDP had gained 7 points among voters aged 50 and over during the first half of the campaign, taking the lead in this category of high-turnout voters.

Chart 11: Pollara Strategic Insights survey results of Ontario election, May 4 & 22, 2018 (50+ voters)

Screen Shot 2018-05-25 at 5.56.14 AM.png

The striking difference in Ontario is the gender split, with men more likely to vote PC, and women more likely to vote NDP at this stage of the campaign.  From what I have seen over the years, there is not a major turnout difference between men and women, like there is with age.

If the poll results stand, the NDP will have blunted a major advantage for the PCs – support among older voters.  Geographically, there is likely still a PC advantage.  The NDP may be gaining in key demographics, but at the end of the day, it matters where the votes are located – in the ridings.  (More on seat models another day).

Pollara’s research also finds an “enthusiasm” advantage for Doug Ford’s PCs.  Ford Nation is already lining up at the polling stations to vote, they’re so excited, though slightly less so than earlier in the campaign.  The NDP voters are the least excited.  Is that just their nature or is their rise in support a bit thin? In terms of impact on votes, if Ford over performs the polls on Election Day, it may well be because he was throwing red meat to his base, regardless of their age.

Chart 12: Pollara Strategic Insights survey results of Ontario election, May 4 & 22, 2018 (Enthusiasm Gap)

Screen Shot 2018-05-25 at 6.05.34 AM.png

What does it all mean?

  • When the voter pool grows, parties must grow with it or perish.
  • Older voters (55+) still rule the roost and constitute a majority (or close to it).  They punch above their demographic weight at the polls.  The party with an advantage in this age group will have a turnout advantage.
  • Youth turnout continues to lag behind, but it is growing and becoming a bigger factor.
  • While it will likely be a record turnout for an Ontario election, it is very unlikely that the June election will keep pace with 2015 federal turnout. The unknown is to what extent 55+ age group exerts control over the outcome, or whether Millennials offset their influence by voting in increased numbers.


Trumping Clinton: 7 days of momentum

USC is running a rolling track poll where they interview 300-400 people a day (online) right through to Election Day.  This is a serious poll with serious methodology.  The numbers shown daily represent seven days of tracking. Each day, the daily results from 7 days ago drop off and the current day is added, making it a rolling track.  This smooths results and shows more of a trendline rather than sudden shifts.  So, if there is a big move, it might not become fully apparent for several days.

For the past 7 days, Donald Trump’s support has increased to, now, a 7 point lead.  This includes several days now of the Democratic National Convention.  Trump certainly had an RNC  Convention bounce but yet to see a Dem bounce.

Chart 1: Election forecast (n=2150)

Screen Shot 2016-07-28 at 10.58.20 AM.png

Some Democratic pundits have cautioned against “bedwetting”.  Yes, it’s July.  There’s a long way to go.

The issue the Democrats have to confront, however, is that Trump can win.  There has been a lot of commentary about how it’s impossible for Trump to win because of lack of support among Hispanics, Blacks, women, etc.  However, he is crushing it with whites and males.


Here is a breakdown of the numbers to show how Trump is rising:

Chart 2: Predicted Winner

While Hillary Clinton is still seen as the likely winner by 49% to 45%, that gap has narrowed from 13 points to 4 points in the past 17 days.  More Americans are believing in the possibility of a Trump presidency – will that help or hurt Trump?

Screen Shot 2016-07-28 at 9.31.21 AM.png

Chart 3: Intention to Vote

Trump and Clinton supporters are virtually tied when it comes to whether they intend to vote.  They have leapfrogged on this.  Trump’s turnout numbers are likely helped because he has strong support among older voters; Clinton’s turnout numbers are likely helped because Trump is highly polarizing and antagonizing.

Screen Shot 2016-07-28 at 9.33.17 AM.png

Chart 4: Seniors 

Trump has a big lead (55% to 38%), and seniors typically vote at a higher rate.  Trump leads 18-34s too, right now.

Screen Shot 2016-07-28 at 9.36.31 AM.png

Chart 5: Whites

Trump leads white Americans 57% to 31%.  African-American voters are 81% to 4% for Clinton.  Hispanics, though, are reported at 50% to 37% for Clinton.  This is where one might wonder if the poll has a large enough, or representative, sample of Hispanic voters.  Or maybe that’s reality – are gender and age are ‘trumping’ race among Hispanics?

Screen Shot 2016-07-28 at 9.38.08 AM.png

Chart 6: Men

Trump leads Clinton by 17 points among men (53% – 36%) while Clinton has a two-point lead among women.

Screen Shot 2016-07-28 at 10.47.19 AM.png

What does it all mean?

Trump can win.  If you can rack up a 7 point lead, you can obviously win.  Even if this poll is inaccurate, other polls are showing Trump is leading.  Even though Hillary has a small lead in Ohio, Trump has a small lead in Florida.

The challenge for Democrats is to approach the race for what it is – a very unconventional campaign.  Trump is attracting voters who are very anti-establishment including alienated Democrats.  How many more examples do we need to see – Rob Ford, Brexit, Jeremy Corbyn, Bernie Sanders, and Trump himself – to understand that there is a very large constituency for those who tap into the vein of frustration, resentment, and anxiety?

This rise in Trump support may be short-term.  It may be illusory.  It may be overstated.  But it proves that Clinton is no shoo-in.   The presidential campaign has been very unkind to her personal popularity and favourables.  Bernie Sanders did a lot to soften her support and drive votes away.  She has gone from a plus 10% to minus 17% in two years.  At her peak back in 2008, she had 69% favourable rating.

Chart 7: Hillary Clinton’s favourables over past two years.

Screen Shot 2016-07-28 at 10.54.39 AM.png


So, the first thing Democrats have to face is that they have a problem.  Now, deal with it.  If the DNC Convention does not move the dial, then it’s time for Plan B, whatever that is.


Jody Wilson-Raybould: a First Nations first in BC

It took 148 years to elect a First Nations women to either Parliament or the Legislative Assembly from British Columbia.  Jody Wilson-Raybould blazed a new trail in last week’s federal election.

Jody Wilson-Raybould, elected in Vancouver-Granville

I wrote earlier how Len Marchand was the first First Nations MP elected 47 years ago, in 1968.  He was also the last First Nations MP elected from BC, when he won the final time in 1974.

@IndigPoli has been providing news and updates about indigenous candidates throughout the federal election process.  The following table is taken from its Twitter feed, outlining the 42 MPs elected from First Nations, Inuit, Dene, and Metis ancestry since Confederation:

That’s 42 indigenous MPs over 148 years –  10 from the 2015 election alone (8 new).  See CBC story.

1960 / 1949

Status Indians right to vote was recognized by Parliament in 1960, only 55 years ago, and 93 years into Canada’s existence.  Prime Minister John Diefenbaker’s Progressive Conservative government was in power at the time, and when Len Marchand was elected in 1968, he thanked Diefenbaker in Parliament for doing what previous federal governments had failed to do.

Screen Shot 2019-02-28 at 3.26.12 PM.png

Hon. Len Marchand’s autobiography

British Columbia had done so in 1949, whereupon Nisga’a leader Frank Calder was promptly elected in the riding of Atlin to the BC Legislature and continued for 30 consecutive years.  He was the first status Indian to be elected to any legislature in Canada and ultimately the first aboriginal cabinet minister in BC history.

Frank Calder sparked the most important rights and title case in Canadian history when Calder (1973), argued by Thomas Bergerwent forward to the Supreme Court of Canada.  The Court ruled that title existed in a decision that reverberates today.

Screen Shot 2019-02-28 at 3.25.40 PM.png

Frank Calder

Why so few from BC?

Not a lot of First Nation candidates have run for office over the years and, clearly, not many have run in winnable seats.

I am not qualified to speak on the unique social, cultural, and financial barriers that many First Nations face in seeking office, but I am familiar with barriers that Canadians, in general, face when seeking office, and they are substantial for anyone when contemplating public office.  It’s both the general election and the party nomination that are the challenge.

One reason why First Nations have been under-represented is the dispersed nature of their population.  There are not many ridings in BC where First Nations form a large ‘bloc’.  And even when you look at the densest concentration of First Nations in a federal riding in BC – Skeena – the reality is that it is made up of many, many different nations, all with different traditions.

Look at Metro Vancouver or the GTA where we are seeing the election of MPs and MLAs from diverse backgrounds.  This is happening in part because of strength in numbers.  Their populations are concentrated in certain areas (eg. Chinese in Richmond, South Asians in Surrey) leading to the election of representatives from their community.  This hasn’t happened to a large extent in Canada, except the North.  It certainly hasn’t happened in BC.

Policies matter too, of course.  Haida leader Miles Richardson ran for the Liberals in Skeena in 2004 with high hopes but finished third to winning NDP MP Nathan Cullen.  Cullen has just been elected to his fifth term and enjoys strong support in First Nation communities.  While a person’s background help, winning candidates usually have to swim with the tide of opinion in their riding.

I worked hard for Marion Wright, a former chief on the North Island.  She fell short in the 2009 election, despite our hopes.  She’s yet another example of a First Nations candidate that would have made an impact, however, she ran up against issues that favoured the NDP.  While improving the party’s standing among First Nations, she lost most FN polls.  Marion tragically passed away not long after that election – she had a lot more to contribute.

One of the keys to Jody Wilson-Raybould’s success is running for the right party in the right riding at the right time.  She was a good candidate, but also had the benefit of swimming with the tide.

Len Marchand first won in 1968 amidst ‘Trudeaumania’ and built the support necessary to hang on in tougher elections in 1972 and 1974.  In 2015, Trent Derrick of the NDP had a chance in Cariboo-Prince George for the NDP but had the national momentum drain away.  If there are more First Nations candidates in viable seats, then more will be elected, simple as that.

Prescriptions

I wrote a term paper in university based on Len Marchand’s work in the Senate concerning aboriginal representation.  Basically, Len argued that – at that time- aboriginal Canadians merited about 3-4% share of the House of Commons based on population but due to the dispersal of its population, did not reach that level.  He argued for guaranteed representation based on the aboriginal population in Canada.  It was hard not to agree with the idea.  We have guaranteed representation for PEI for pete’s sake.  Guaranteed for Saskatchewan.  Guaranteed for Quebec.  Guaranteed for Nova Scotia and New Brunswick.  Special deals here.  Special deals there.

Geographic deals are one thing, but the idea of parliamentary seats based on background seems to go against the grain in Canada.  Perhaps this election is showing guaranteed representation may not be necessary, though there is still a long way to go before First Nations are represented in proportionate numbers.

The State of Maine has had two non-voting seats on the floor of the Assembly for the Penobscot and Passamaquoddy tribes since the early 1800s.  Is this a potential model – to provide a stronger voice for aboriginal people on the floor of the House if the numbers of elected members are not proportionate to their population?  (In 2015, the Penobscot and Passamaquoddy decided to vacate their longstanding seats over their concerns with the Maine government.)

First Nations have strong leaders at the community level, engaging with the federal and provincial governments on a nation-to-nation basis.  The argument that representing one’s nation is more impactful, instead of being a small part of a larger parliamentary institution must be compelling.

One thing is certain, more aboriginal people voted this election and more were elected.  Parliament will be better informed by those perspectives as a result.  Len Marchand and Frank Calder have shown the type of impact they have had within these institutions.  Now it’s Jody Wilson-Raybould’s opportunity to blaze a new trail, 148 years in the making.

Turnout and Chinese representation – Low and Low

By Gabe Garfinkel

In the final days of the federal election, respected community leader Tung Chan and Mike McDonald – publisher of this blog, contended that Chinese-Canadians’ voting intentions are not being adequately reflected by public opinion polls. Tung and Mike were right (as usual), but the problem of Chinese-Canadian participation in Canada’s electoral system goes beyond the polls.

The 2015 federal election demonstrated that Chinese-Canadians are not coming out to vote and Chinese-Canadian Members of Parliament are not being elected, proportionate to their numbers.

Let’s look at BC.

Hon. Alice Wong, re-elected in Richmond-Centre. One of two Chinese MPs from BC.

The five ridings with the highest Chinese population ranked in the top six lowest turnouts in the province. Richmond Centre, which holds highest percentage of Chinese-Canadian citizens (44.3%) in the province, had the lowest voter turnout (59.0%).
The top ten ridings with the highest Chinese-Canadian populations all fell within the sixteen ridings with the lowest voter turnout. The ridings with the highest Chinese populations correspond to the ridings with the lowest voter turnout. Period.

Riding Percentage Chinese Population Ranking (out of 42) Percentage Voter Turnout Voter Turnout BC Ranking (out of 42)
Richmond Centre 44.31% 1 59.0% 42
Vancouver Kingsway 32.50% 2 63.6% 38
Vancouver South 32.23% 3 63.7% 37
Steveston-Richmond East 29.67% 4 60.4% 41
Burnaby South 28.29% 5 61.0% 40
Vancouver Granville 24.66% 6 68% 32
Vancouver East 19.91% 7 66.9% 34
Burnaby-North Van Seymour 18.36% 8 70.0% 27
Vancouver Quadra 18.03% 9 68.5% 30
Coquitlam-Port Coquitlam 12.73% 10 67.3% 33
New West – Burnaby 11.69% 11 66.6% 35

Voting and polls only tell part of the story of Chinese-Canadians’ low participation in the electoral process. Of the 338 new MPs arriving in Ottawa, only five are of full Chinese descent and only three are in the new Liberal government: Arnold Chan (Scarborough-Agincourt), Shaun Chen (Scarborough North) and Geng Tan (Don Valley North). There is not a single Liberal Government MP of Chinese descent in BC, a province with over 430,000 Chinese-Canadians in Metro Vancouver alone. As Tung Chan stated, “Across BC, over 1 in 9 are Chinese”. Yet, only 2 of 42 BC MPs are Chinese. Alice Wong (CPC – Richmond Centre) and Jenny Kwan (NDP – Vancouver East) are the sole Chinese-Canadian MPs in BC.

Alone, the statistics are indeed surprising. When looked at comparatively with another large ethno-cultural population in Canada, they are shocking.

There are approximately 1.6 million South Asians in Canada, slightly more than the 1.4 million Chinese-Canadians. Sikh Indo-Canadians have famously participated in Canada’s democratic process since the 1970’s. The 2015 federal election elected the most South Asians in Canada’s history – twenty. That is four times (!) the amount of elected Chinese-Canadian MPs, eighteen of whom are in the Liberal Government.  Four of BC’s 17 Liberal MPs are Indo-Canadian.

As heartening it is to see one minority group in Canada participate in democracy, it is equally disheartening to see another not being fully represented. We can speculate that other forms democratic engagement – volunteering, party membership and political donations – are also disproportionately low amongst Chinese-Canadians.

Not all communities participated at an equal level during the election that saw a high voter turnout.

Gabe Garfinkel is a communications and public affairs consultant with FleishmanHillard Vancouver. He has held senior positions in government and on political campaigns advising on multicultural communications, media, and policy. (Gabe and I worked together once-upon-a-time, I appreciate his contribution to the debate – Mike)

The Chinese community and the federal election: did anyone ask what they think?

Co-authored by Tung Chan 陳志動, former CEO of S.U.C.C.E.S.S. 

It would be nice to know what Chinese-Canadians are thinking about the federal election.  It would also be nice if they had been being asked… properly.

In Metro Vancouver, over 430,000 Chinese-Canadians make up 19% of the region’s population, which is a conservative estimate since this is based on the 2011 census.  Across BC, over 1 in 9 are Chinese.

The concentration is higher in areas like Richmond, Vancouver, and Burnaby.

The impact of the Chinese-Canadian vote on a significant number of federal ridings is undeniable.

Riding Cantonese Mandarin Chinese NOS* Taiwanese Total
Richmond Centre 16.77% 12.22% 14.61% 0.71% 44.31%
Vancouver Kingsway 18.32% 3.22% 10.89% 0.07% 32.50%
Vancouver South 17.50% 3.63% 10.82% 0.28% 32.23%
Steveston-Richmond East 13.10% 8.22% 8.14% 0.21% 29.67%
Burnaby South 7.49% 10.84% 9.28% 0.68% 28.29%
Vancouver Granville 8.07% 7.60% 8.32% 0.67% 24.66%
Vancouver East 11.65% 1.65% 6.56% 0.05% 19.91%
Burnaby-North Van Seymour 7.62% 4.65% 5.83% 0.26% 18.36%
Vancouver Quadra 4.29% 6.89% 6.43% 0.42% 18.03%
Coquitlam-Port Coquitlam 4.70% 3.86% 4.04% 0.13% 12.73%
New West – Burnaby 3.29% 4.37% 3.80% 0.23% 11.69%

*Not otherwise specified (NOS)

Every day, new opinion polls are being reported by the media.  These polls only tell part of the story, because we have no way of knowing if they are talking to a proportionate share of Chinese-Canadians.

Why?

  • Telephone surveys – there is no indication that media polls are being conducted in-language for those that speak comfortably in Cantonese and Mandarin, but not English.
  • Online surveys – those that are not confident in English are not likely to participate in an online panel.
  • IVR surveys – automated messages for media polls are almost always in English.

A tell-tale that multicultural communities, such as Chinese-Canadians, are not being properly represented is that polls are not weighted to reflect these communities.  In other words, if 25% of a riding has a Chinese language as their mother tongue, the poll should have a sample of 25% Chinese.  This isn’t happening.

Yes, some Chinese Canadians will be participating in these surveys but, it is likely below their share of the electorate, for the reasons listed above.

A recent example are riding polls released by organizations like Lead Now and the Dogwood Initiative.  They did not release a breakdown of ethnicities in riding surveys conducted in Burnaby-North Vancouver Seymour (18% Chinese) or Vancouver South (32% Chinese).  If they have under-reported the Chinese Canadian voters in those ridings, they may well be providing voters with a misleading portrait.

We would love to be proven wrong, but it is clear to us that media polls (usually polling that is provided free of charge to news outlets or released into social media) has a cultural bias.  It simply costs more to do it right.

It is true that the voter turnout rate for Chinese-Canadian voters can be lower than BC average.  The provincial riding with the highest population of Chinese Canadians, Richmond Centre (49.88% of population), also had the lowest turnout rate (43.65%) suggesting a lower turnout rate from that community.

Voter participation increases as proficiency in English increases and as length of residency in Canada increases.  This is intuitive – as newcomers become more integrated into their community, they tend to participate more.  Even with lower voter turnout, the impact of Chinese Canadian voters cannot be ignored.

Though in the recent transit plebiscite, the voter turnout rate in Richmond was almost the same as the region-wide average.  Low turnout among Chinese voters may in fact be overstated.

So, does this even matter?

Chinese-Canadian voters, on the whole, tend to have different values than other groups.  The results of the 2010 HST referendum show this.  Only 25 of 85 provincial ridings supported the HST, with the strongest BC Liberal seats being among those that provided the most support.  Yet, BC Liberal strongholds in Richmond and South Vancouver voted overwhelmingly against the HST.  It was a major swing compared to other BC Liberal ridings with lower Chinese populations. Chinese Canadians surely made a critical difference; the HST had taken a beating in Chinese media and at the retail politics level.

The following table shows 7 BC Liberal ridings based on proportion of Chinese Canadian population (mother tongue).  While 24 of 49 BC Liberal constituencies voted in favour of the HST, only 1 in 7 of the ridings with the highest Chinese population supported the HST.  The exception being the seat of the Finance Minister.  The 2010 pro-HST vote and BC Liberal 2009 election vote were almost identical on a BC-wide basis.  But in these 7 ridings, all with a Chinese Canadian population of over 20%, the pro-HST vote runs behind the BCL vote significantly, with the highest Chinese ridings having the highest discrepancy.  Even Quilchena, which had a pro-HST vote of over 60%, ran behind its BC Liberal vote.

BC Liberal-held ridings Chinese % (mother tongue) Riding Pro-HST vote 2009 BCL vote Diff: HST-BCL
Richmond Centre 49.96% 36.23% 61.51% -25.28%
Richmond East 37.88% 34.42% 58.73% -24.31%
Vancouver Langara 35.41% 38.35% 58.87% -20.52%
Vancouver Fraserview 32.15% 33.99% 49.29% -15.30%
Richmond Steveston 31.88% 44.81% 60.78% -15.97%
Vancouver-Quilchena 26.98% 62.40% 70.22% -7.82%
Burnaby North 22.68% 39.66% 48.19% -8.53%
British Columbia 8.20% 45.27% 45.82% -0.0055

We want to make it clear that the issue we are raising is not solely a Chinese Canadian issue.  This is a South Asian issue, a Filipino issue, a Korean issue, a Persian issue.  For example, the 45 % of residents in the riding of Surrey-Newton say that their language at home is not one of Canada’s official languages, with the largest group speaking Punjabi.  Metro Vancouver has changed and will continue to do so.

In this election, the smart political parties are tracking opinion carefully so that they know what is actually going on.

Media outlets and any organization conducting research should be no different as when they fail to account for large segments of the population, they are ignoring them at their own peril.

Postscript:

A 2009 survey of Cantonese and Mandarin speakers for S.U.C.C.E.S.S. by Innovative Research Group  provided interesting insights into newspaper reading habits.  Even among those Chinese-Canadians fluent in English, Chinese media sources were preferred.