WARNING. This is a dark art.
BC election results usually follow the pattern of the previous election – the strongest and weakest ridings for each party generally stay the same, but there are exceptions, of course.
If one applies various popular vote scenarios to the previous map, you can see how the seats move. Thus, I applied popular vote scenarios for the NDP and BC Liberals to the 2017 map and produced seat estimates.
As you can see below, 40% for NDP and 40% for BC Libs produces the seat count from 2017 – 43 BC Lib, 41 NDP, and 3 Green.
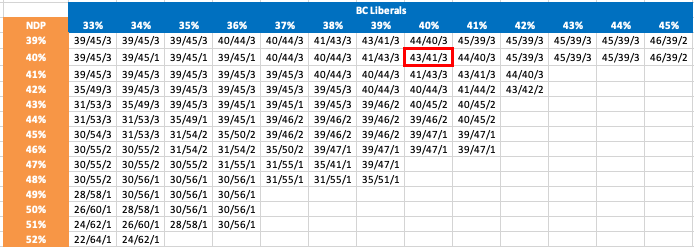
If, when this is all done, the NDP have 46% and BC Libs 37%, then the dart lands 50 NDP seats, 35 BC Lib, and 2 Greens. If BC Libs win 41% of the vote and NDP 39%, then it’s a BC Lib majority of 45 seats to 39 seats. Since the polls have mainly showed NDP leads, most of the scenarios have NDP majorities. However, if the BC Libs exceed 46% of the popular vote tonight, I will be delighted to update my blog post.
Exceptions, exceptions, exceptions. I know, I know. This is a crude, one-size-fits-all approach. While this model does not show it, it is possible for the BC Liberals to win a plurality of seats while losing the popular vote if regional differences become more pronounced. For example, if BC Libs win seats by small margins, especially in rural BC, but get blown out in NDP strongholds, that could happen. The reverse took place in 1996 when Glen Clark led the BC NDP to a majority government despite losing the popular vote by 3 points.
I prefer a more regionalized model that is more fine-tuned to shifts within urban-suburban-rural audiences. But, that’s a lot of work, and I need to have dinner. Can’t blog on an empty stomach … especially on Election Night.
