One of the more interesting election websites is “Too Close too Call” – an election forecast site produced by Bryan Breguet, a Ph.D student in Economics at UBC. I haven’t met him but admire his work.
It seems like he’s beating himself up a bit about his predictions today. I took a spin on his seat forecasting model and inputted the actual popular vote numbers from BC. His model extrapolates the final results fairly accurately. Seat forecast models basically extrapolate the new pop vote numbers on a platform of the previous pop vote numbers (2011).
Here is the result:
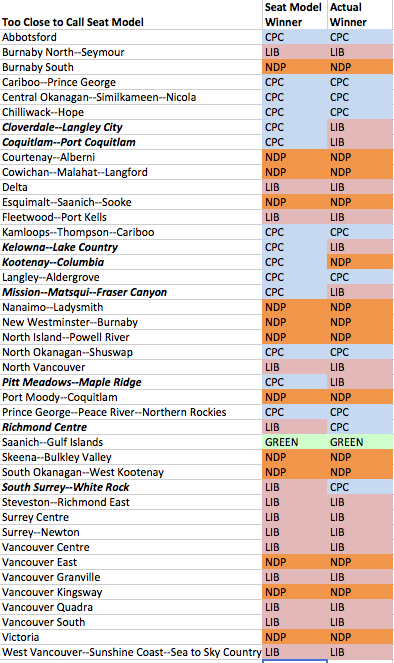
His accuracy is 81% (34 out 42). Not bad. That’s a B in most schools.
What interests me are the differences – why do some ridings break the pattern?
In BC, those eight ridings – based on Too Close too Calls model – are:
- Cloverdale-Langley City
- Coquitlam-Port Coquitlam
- Kelowna – Lake Country
- Kootenay-Columbia
- Mission-Matsqui-Fraser Canyon
- Pitt Meadows-Maple Ridge
- Richmond Centre
- South Surrey-White Rock
I will offer a theory:
- These were all CPC seats to begin with
- Five of eight seats did not have an incumbent seeking re-election. (Conservatives lost 4 of 5 with new candidates)
- The Conservatives won two of the seven outliers
- Richmond Centre – bucked the trend for the CPC because of incumbency advantage. Possibly retaining stronger support among Chinese.
- Dianne Watts bucked the trend in South Surrey because she was a much better candidate for CPC than her predecessor.
- Kootenay-Columbia was going to be close under these circumstances, though the NDP outperformed there, defeating a CPC incumbent in a squeaker.
- Kelowna-Lake Country was a Liberal surprise, perhaps reflecting changing demographics in BC’s most urbanized Interior City.
Candidates make a difference, especially incumbents. A closer look at popular vote per riding based against the model would show this too, but it’s the winning and losing that matters most.

Hi, thanks for the nice post.
Yeah with the correct vote percentages, my model was working not too bad. Although I was still quite off in Ontario and I’ll have to look at the reasons why it was the case. In BC, it seems the model was off in the suburb. Although I’ll say that I’m more concerned about how off I was in terms of %. Like if I was predicting 45-44 and we got 43-46, I don’t feel too bad. So there as well, I’ll have to take a look.
But I want to say that I did try to account for the ridings without an incumbent seeking reelection, especially when it was a long term one. Maybe my effect (additional drop of 5 points) was too low but this is what past election results gave me.
I do agree though that I’ll need to look at getting more info at the riding level (like how strong the candidate is, etc), but it’s not easy.
LikeLike