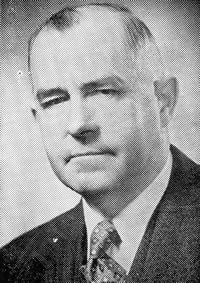
50 years ago this week, in the riding of Dewdney, an earnest 36-year old father of five stepped into a provincial election campaign, hopeful for a breakthrough for a new generation of politics. Instead, Premier W.A.C. Bennett outfoxed the opposition parties, earning an unprecedented seventh consecutive term.
It was W.A.C.’s greatest and sweetest electoral triumph, but it was also his last.
This is the story of that campaign, what led up to it, and how its outcome changed the course of BC politics. It’s also the story of Peter McDonald, Liberal, Dewdney riding.
My Dad.
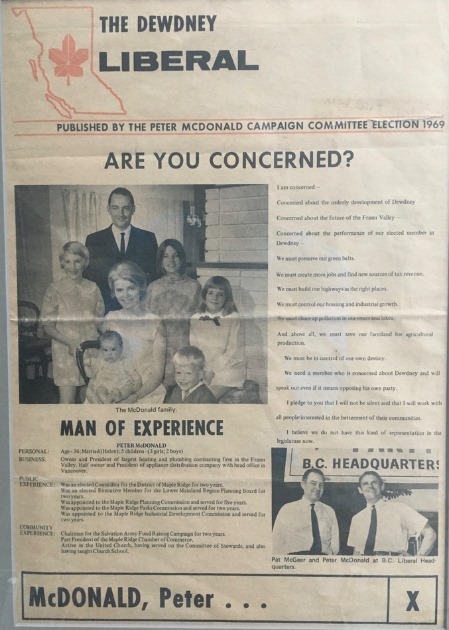
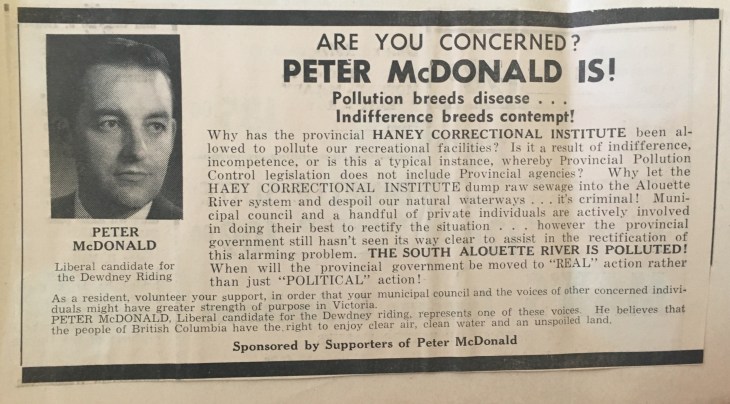
Front page of 4-page McDonald campaign brochure
Leading up to 1969
Politics were very lively in the 1960s. Federally, John Diefenbaker and Lester Pearson dueled three times between 1962 and 1965.
Unrest and tumult south of the border were in full view – civil rights, Vietnam, and, in 1968, the assassinations of Martin Luther King and Robert Kennedy. Pierre Trudeau catapulted into the leadership of the Liberal Party of Canada on a wave of “Trudeaumania.”
The times were a changin’, but not so much in British Columbia.
The Social Credit government was clocking in at 17 consecutive years. Impatient politicians like 36-year old BC NDP leader Tom Berger, an accomplished lawyer, and 42-year old BC Liberal leader Pat McGeer, a prominent academic, sought to surf generational undercurrents into office against the man who seemed from another time – W.A.C. Bennett.
The response from this 69-year old, teetotalling merchant from Kelowna? The Good Life– a grand narrative of progress under Social Credit rule combined with blunt attacks on the Opposition as Marxist radicals.
Like many long-serving governments, they were young when they started but now looking old.
In the previous four elections, W.A.C. had faced NDP (and CCF) leader Robert Strachan. Each time, same result – a Socred majority. In six mandates, the Socreds had disposed of three CCF/NDP leaders, not to mention chewing through Liberal and Conservatives leaders as well.
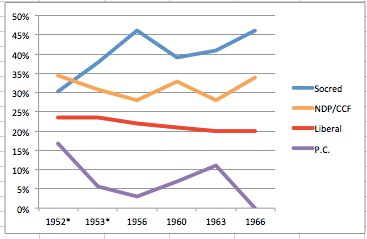
B.C. popular vote: 1952-1966
Though Strachan was 13 years younger than W.A.C., he was facing a challenge from a even younger generation within the NDP. In 1966, Tom Berger was elected MLA from Vancouver Burrard at age 32. He had already been a one-term Member of Parliament, president of the BC NDP, and built a reputation as a labour and aboriginal rights lawyer.
There was no doubt he was an up-and-comer.
Berger challenged Strachan in 1967. In a party convention, Strachan pushed Berger back and remained leader, but the damage was done – to Strachan, and ultimately to Berger too. The party was deeply divided. Strachan resigned as leader in 1969, setting up a leadership race between Berger, backed by Labour leaders, and Dave Barrett, first elected in 1960 and, like Berger, still in his 30s.
It was a hotly contested battle. Berger edged out Barrett, entrenching deep divisions. It was now Berger’s task to dethrone W.A.C., a man clearly of another era.
Meanwhile, the Liberals were also in the midst of a change. Outgoing leader Ray Perrault took on the leadership in 1959 and led the party through three elections. He restored credibility, electing a small but talented caucus – but the party was stuck on 20% of the popular vote. It wouldn’t budge.
Perrault opted to leave for federal politics and in 1968, pulled off one of the great upsets in BC federal political history, shockingly defeating national NDP leader Tommy Douglas.
A leadership was contested between two seatmates from Point Grey – Dr. Pat McGeer and Garde Gardom, with McGeer prevailing. The nephew of former Vancouver mayor/MLA/Senator/MP Gerry McGeer, he had a political pedigree and lengthy list of education credentials to match it. He entered the 1969 campaign, leading a strong slate of candidates, sure it was their time for a breakthrough.
In the riding of Dewdney, stretching from the blueberry farms of Pitt Meadows to the corn fields of Agassiz, a young, small businessman was gearing up for his provincial run.
Peter McDonald engaged his passion for politics when he moved to Haney in 1959. He managed his brother’s federal Liberal campaign in 1965, was elected as Alderman in Maple Ridge, and was an active participant in Liberal conventions. He even had a chance encounter with Robert Kennedy during the 1968 primaries, further adding fuel to his political engine.
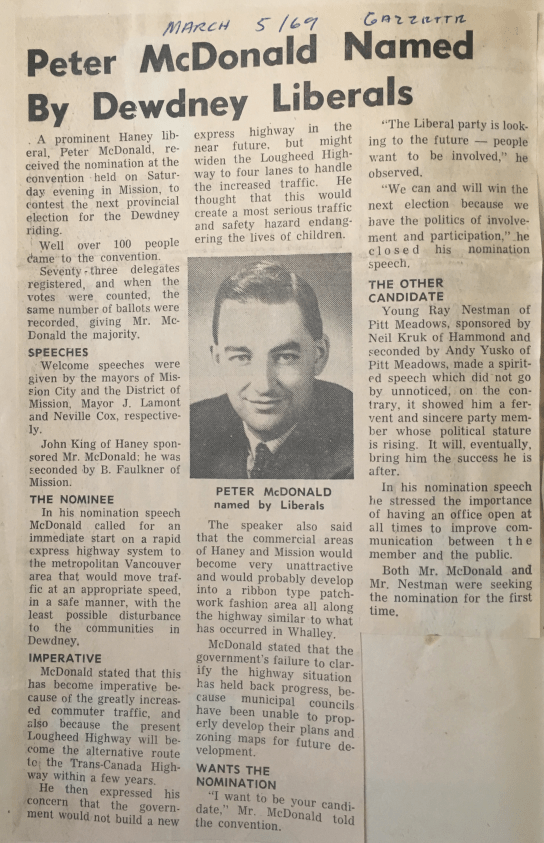
For years, he ran the Haney Liberal association, which had a strong and active membership. Now was the time to plant a Liberal flag in a riding that had swung in recent years between the NDP and the Socreds. Held by Socred cabinet minister Lyle Wicks in the 1950s, a social worker named Dave Barrett took a job at Haney Correctional Institute. He was encouraged to run by a visiting CCF MLA and then tracked down the local CCF stalwart (and renowned school teacher) Hank Tyson in a Haney parking lot to declare his interest. As Barrett became politically active, he was fired by the Social Credit government. It was front page news; Barrett went on to win the NDP nomination and ultimately dispatched Wicks in the 1960 election.
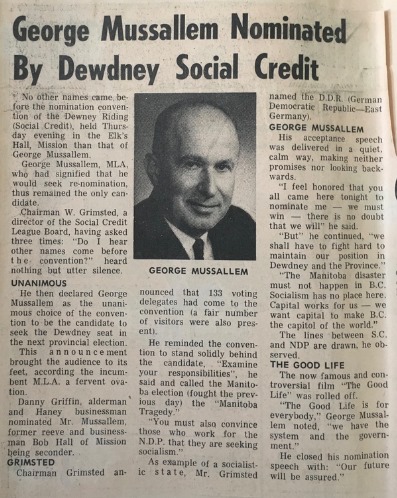
Barrett represented Dewdney until 1966 then moved to a newly-created seat after a boundaries change. That opened up Dewdney for George Mussallem, a local car dealer whose father, Sol, was a longtime reeve of Maple Ridge. Mussallem restored the seat to the Socreds in 1966 and was readying himself for re-election in 1969. The NDP nominated young lawyer Stu Leggatt.
For McDonald, winning would be a longshot, but the wave of Trudeaumania that propelled Liberals to their best-ever showing in B.C. was just a year old. They hoped a tired governing party would find that momentum irresistible.
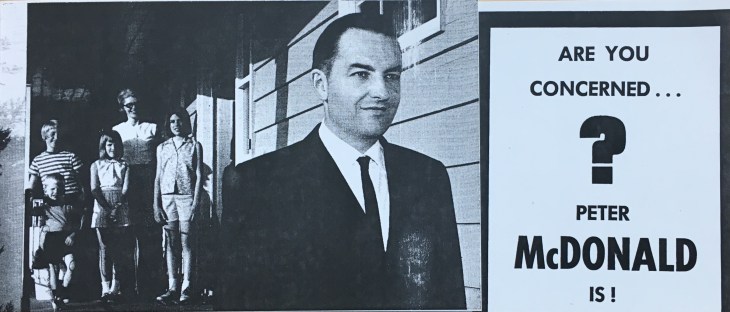


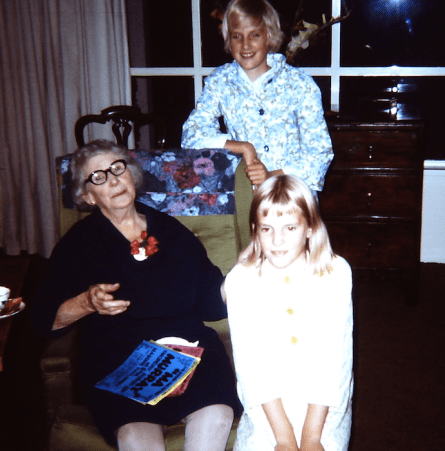
Three images above are a one-fold, horizontal flip brochure for McDonald campaign (front, inside, back). The candidate is clearly starting far into the future while the rest of the family is clearly delighted that the youngest child is asleep in his cradle. On inside flap, a copywriter’s line has double-meaning: “His wife, Helen, and their five children have provided Peter with justifiable reason to be concerned about problems facing Dewdney and B.C.” I’ll say!
The Good Life
W.A.C. headed into the 1969 campaign touting The Good Life. David Mitchell writes:
 After seventeen years in power, Canada’s senior premier declared: “Today, British Columbia is the No. 1 haveprovince in the nation… No other government with only 2 million people can do what we are doing”. In the spring of 1969, in what was widely believed to be the kickoff for a provincial election, the premier embarked on a 10,000 mile grandstanding tour of the province showing audiences of all sizes a controversial government-commissioned film, a glossy review of the rise of British Columbia. Its title was – what else – “The Good Life”.
Underpinning TheGood Life were the benefits that flowed from natural resource development, industrial expansion, and fiscal restraint. While governments elsewhere ran deficits, W.A.C.’s governments ran surpluses. This message spoke to the Socred base of small businesses, farmers, and, generally, rural BC. In 1969, the outlying areas of the province had much more political clout than they do today.
The May 8, 1969, edition of the Vancouver Sun ran the transcript of The Good Lifein its entirety. It describes successes, industry by industry, from forestry to petroleum to tourism. W.A.C. describes new programs to assist young homeowners, and extolls the province’s health care and education system, and its parks and natural beauty. The 27-minute film closes with W.A.C.’s final exhortation:
“Through this great unity of purpose British Columbians have achieved the good life and we are on the way to become an affluent society. In this abundant life, God has given us a great trusteeship. He has given us an opportunity to serve our generation not only our generation but those yet to come. And for my part in that purpose I am truly grateful.”
W.A.C. took the film on the road, showing it to audiences across the province. Barely three years into his mandate, only he knew when the next election would take place. The other parties would be kept guessing while the Premier assessed the effectiveness of his publicity blitz.
A Prince George Progress editorial (June 4th, carried in the Hope Standard), sums up the skepticism toward the film and also its effectiveness.
“The Good Life” was shown at the Northern Interior Lumbermen’s Convention on Friday and in several occasions becomes obvious why it’s controversial… The film, which opens and closes with the Premier’s smiling countenance and expansive feelings about B.C. also tends to boggle the mind with facts and figures… All in all, however, the film does justice to the province and if there was ever a media capable of enticing immigrants from “those other provinces”, “The Good Life” is it.
W.A.C.’s devotion to The Good Life message was impressive. Upon astronaut Neil Armstrong’s first footsteps on the moon, he remarked to the press gallery “he still thanks God for ‘the good earth’ and B.C. in particular – the province of the ‘the good life’”. In that same interview, he was asked about rumors of a potential fall election. W.A.C. said his mind “is only on that wonderful flight to the moon.”
He called the election the very next day.
The Electoral Standings
The parties entered the 1969 campaign much as they had in the previous four. The Socreds ranged from 39% to 46%; the CCF from 28% to 34%; and the Liberals were on a very small decline from 22% to 20%. For their part, the Progressive Conservatives had been vanquished.
The Campaign Kicks Off with Turbo-Polarization
“Bennett Lays His Good Life on the Line” is the above the fold headline on July 22nd.
The page one article quotes W.A.C. as saying Marxist socialism is masquerading under the name of the NDP and that he was staking his party on the “bread and butter issue” – the welfare of B.C. workers.
W.A.C. said, “This will be the election of the great switch. Liberals and Conservatives will be voting for us as they have never before… The issue is a clear-cut one between the NDP Marxian socialists and the free enterprise Social Credit.”
Berger retorted that the election announcement was a “hysterical outburst by a pathetic old man clinging desperately to office”.
McGeer was bullish: “I would certainly be satisfied with a minority government, although of course, everyone hopes to win a majority. There’s no region in which we’re weak. I know we’re going to astonish the press who have misread the situation entirely in terms of free enterprise and socialism.”
The Teams
The Socreds had continuity at the top, but there was some churn in the team. Longtime Attorney-General Robert Bonner left politics in 1968. While a handful remained, many that started the Socred voyage in 1952 and been outlasted by their premier. Phil Gaglardi was back though. He had been bounced from cabinet for transgressions but hadn’t given up on politics.
The pirate mayor of Nanaimo Frank Ney had emerged to take on NDP MLA Dave Stupich. W.A.C. hoped to win Oak Bay with Dr. Scott Wallace and wrestle the seat from the Liberals. Former Vancouver mayor, and former Liberal candidate, Bill Rathie, was recruited to run against McGeer and Gardom. Football and broadcasting legend Annis Stukus contested North Vancouver-Seymour against Liberal MLA and broadcaster Barrie Clark.
Berger had only been leader since the spring. He had 17 seats, and would need another 11 for a majority. Two seats were for the taking in Vancouver-Centre, contested by Emery Barnes and lawyer William Deverell. The Party had won a byelection in Vancouver South and hoped for a second seat for Party linchpin John Laxton. Ridings with significant unionized workforces like Skeena, Alberni, and Rossland Trail were in Socred hands.
McGeer started with a base of six MLAs concentrated in Point Grey and the North Shore, with one MLA in Oak Bay. Renowned UBC forest economist Peter Pearse ran in Vancouver-Little Mountain. David Zirnhelt, the high-profile head of the UBC AMS, ran in his home riding of the Cariboo. Mel Couvelier and Ian Stewart were regarded as strong candidates in Victoria. Rancher Mack Bryson was expected to make a strong showing in Kamloops, following in the footsteps of Len Marchand’s decisive federal win in 1968. Longtime Prince Rupert mayor Pete Lester signed on to McGeer’s team. Young candidates like Tex Enemark (Fort George) and Bob Plecas (Nanaimo) were recruited to fly the flag.
Progressive Conservative leader John de Wolf was the only candidate for his party, running in Point Grey.
The Dewdney campaign
Looking back on the Liberal campaign in Dewdney, it was impressive. For a party that had not seen great results there for decades, Peter McDonald was all in.
McDonald pushed the issues with vigor. In a hand scrawled list, planned news releases included “School Taxation Cuts”, “North Shore Highway”, “Incentives for Secondary Industry”, “Blueprint for the Fraser Valley”, “Lougheed Highway”, and “B.C. Hydro”. Stories were targeted to newspapers in Haney, Mission, and Agassiz.
 He championed water quality in the Alouette River, decrying it as unsafe for swimmers due to a pollution issue upstream from the provincial prison. Photos showed him collecting water samples that were sent to the lab, bolstering his claims.
 News releases bombarded local media and he earned mentions in the Vancouver papers as well. Leader Pat McGeer came to the riding to make the rounds (“McGeer listens to Farmers’ Beefs”). Door knocking abounded. Lawn signs sprouted up.
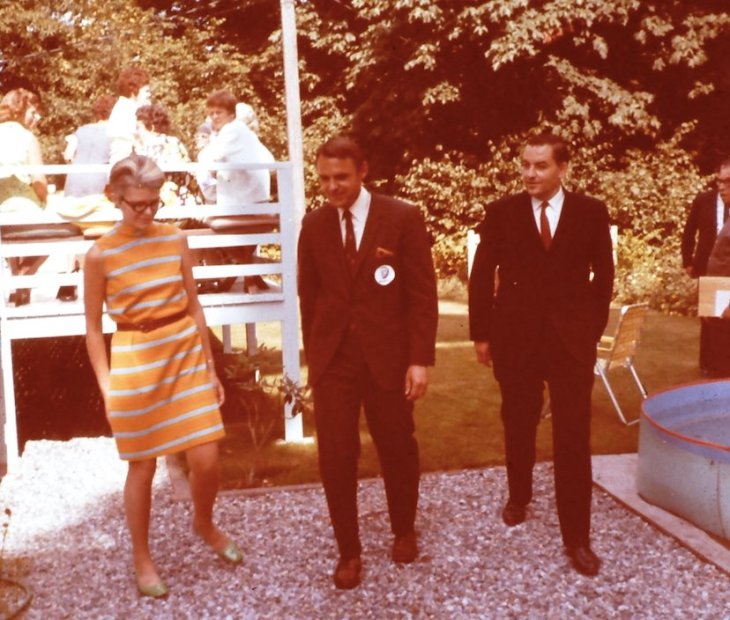
McGeer (centre) attending campaign event at McDonald home on River Road, Haney. Helen McDonald (left), Peter McDonald (right)
Political campaigns always have an impact on the family of the candidate; it is very difficult for a candidate to run without his or her family’s full backing. McDonald had the unwavering support of his wife, Helen. Vertical strips from the Haney phone book were tacked to the wall by the phone. Each strip was a column of phone numbers that Helen would phone to seek support for Peter, while raising five kids 13 and under – including me, at 9 months old.

Shrine to the McDonald campaign on bedroom door
His oldest daughter, Sara, recalled the humiliation of riding in the Liberal parade car desperately trying to avoid being seen by slumping down low and avoiding eye contact with classmates.
McDonald was pulling out the stops – he just needed to wait for that Liberal wave.
NDP candidate Stu Legatt’s campaign ran newspaper ads with that old beauty of a slogan, “Time for a Change.”

MLA George Mussallem rolled out the Socred messaging: “Socialism has no place here” and “The Good Life is for everybody. We have the system and the government… Our future will be assured.”
The Campaign – prosecuting the Marxists
W.A.C. made his case for the Good Life. However, to sustain his attacks on the new, ‘city slicker’ ‘Marxist’ labour lawyer, Tom Berger, he needed a hook.
Shortly after his bruising leadership campaign against Dave Barrett, Berger said he would nationalize BC Tel. It wasn’t planned, but the policy had been floated by NDP MLAs during the leadership race. It gave W.A.C. an opening. W.A.C. had formed state-run companies BC Ferries and BC Hydro – but in 1969, this was apparently a step too far.
Five days into the campaign, Berger was on page two of the Vancouver Sun explaining his BC Tel promise. That old saying comes to mind, “If you’re explaining, you’re losing.”
According to Pat McGeer’s book Politics in Paradise, Bennett blamed many circumstances on Berger. A wildcat transit strike in Vancouver: “Wasn’t that a terrible thing for Berger to call the bus strike?”
Berger’s own messaging played into Bennett’s strategy. Geoff Meggs and Rod Mickleburgh recount in their book The Art of the Impossible that NDP billboards and newspaper ads featured Berger in a suit carrying a briefcase, with the headline “Ready to Govern.” Berger had told the NDP convention, “The time has come to form government.” Bennett responded with, “Strike pay with Berger or take-home pay with Bennett”.
Having an NDP leader talking about governing was exactly what Bennett wanted. Combined with having Berger on the defensive over BC Tel, he was successfully polarizing the election ensuring that enough voters would reinforce the old premier rather than risk a ‘radical’ NDP government by voting NDP or vote-splitting by voting Liberal.
A key distinction between W.A.C. Bennett’s campaigns and those that followed to current day is the perception of whose side the parties are on. W.A.C. ran against the elites. He nationalized the ferries and the electricity company, and built major hydroelectric dams.
He may have been older, outdated, and not with the times – but he put himself on Main Street, B.C – not a natural place for the labour lawyer or the Point Grey academic from Point Grey.
The Campaign Takes Shape
There was no leaders’ debate. Opinion polls were forbidden during the campaign. All parties had large rallies around the province where hundreds would attend, often punctuated by heckling.
There was a lot of print media coverage, but it was difficult for the opposition parties to lead the narrative. In a post-election article, Vancouver Sun columnist Allan Fotheringham tabulated that during the campaign, his paper devoted 537.5 inches of type to the Socreds on page one, compared to 273 inches for the NDP, and 159.5 inches to the Liberals. Columnists devoted three times as much ink to the Socreds as the NDP and very little to the Liberals.
Presumably, the Socreds had a much bigger war chest as well, not to mention the Good Life campaign that preceded the campaign.
Regardless, the media –as the media does – generated coverage that built the sense it was a hot race. From afar, the Regina Leader-Post said, “This will be no cut-and-dried contest.” The Toronto Globe & Mail opined that, “Many Canadians, in and out of British Columbia, would rejoice in Mr. Bennett’s defeat”, comparing him to Quebec separatist Réne Levesque. The recent election of Ed Schreyer’s NDP government in Manitoba fueled speculation.
In the first week of the campaign, the Socreds had an unexpected issue in Rossland-Trail. Robert Sommers, who had served as Minister of Forests (and also two years of a five-year jail term for bribery and conspiracy in the issuing of forest management licenses) attempted a political comeback by challenging the Socred incumbent. The drama played out over the first week of the campaign, but ended July 28thwhen Sommers protested the rules and withdrew from the race. A threat to run as an independent did not materialize.
The leaders criss-crossed the province, with a majority of seats outside the Lower Mainland. In fact, it was reported by Canadian Press on July 30ththat McGeer was shadowing Berger’s tour through itinerary a day later.
That same day, W.A.C. struck hard: “Mr. Berger has said himself he’s a Marxist socialist, though he’s trying to back away from it now. He’s scared everybody including himself.” Nine days in, W.A.C. was still on his core message. Ten days in, the Vancouver Sun’s lead editorial was “Mr. Berger and the telephone company…”
On August 7th, W.A.C. continued his focus on making the choice between “Bennett or Chaos; free enterprise or the heavy hand of state socialism”, he charged. That same day, the Province editorial page dedicated more time to Berger’s BC Tel “takeover.”
With 15 days to Election Day, reporter Bob McConnell wrote that, at that point of the campaign, W.A.C. had not toured. While he had traveled to a First Ministers’ conference, when he was in B.C., he was in his riding “sketching out the issue (free enterprise versus Marxian socialism)”.
He had made some promises such as second mortgages at lower interest rates, increased old-age pension supplements, and more spending. None of his cabinet ministers had made any major speeches or policy statements and the party seemed to be relying “mainly on a fat budget for radio, TV, and newspaper advertising.”
Once W.A.C. was on the road, he made waves. In a noisy Salmon Arm rally on August 13th, he said that an anti-Trudeau demonstration in Vancouver was organized by Berger. Amidst the noise of the hecklers, W.A.C. charged, “You can see it here tonight – that’s their tactics.” The Vancouver Sun devoted an article below to Berger’s denial. Berger said, “We have found no one listens to Bennett any more and no one believes him. These attacks make me angry… but I’m not going to reply in kind.”
With 9 days to Election Day, McConnell reported that NDP strategists were “flatly predicting victory,” stating they would hold their 17 seats and pick up another 11 in places like Rossland-Trail, Prince Rupert, Alberni, Dewdney, Nelson Creston, and Vancouver-Centre. The NDP sources claimed they had stronger volunteer support than previous campaigns. Socred strategists responded that they too had unprecedented volunteer support and while Berger and McGeer started touring early, the Socred’s “big guns are just starting to open up.”
At a rally of 800 supporters in Kamloops, W.A.C. promised that ‘Flyin’ Phil Gaglardi would return to cabinet full-time, a rare promise of cabinet-making on the campaign trail. For his part, Berger announced that former NDP leader Bob Strachan would serve his as a “senior cabinet minister” if elected.
On the streets of Vancouver-Centre, NDP candidates Emery Barnes and William Deverell were campaigning aggressively to unseat the two Social Credit incumbents. A post-campaign feature in MacLean’s profiled the duo.
Liberal Hopes
As the campaign wore on, the Liberals were in desperate bid to stay relevant. They were not without their successes.


A 700-car parade of Liberal supporters was held in Kamloops, which, by any metric, should be a sign of victory.
McGeer said the Liberals could win a minority government with 21 seats and that eight seats were “swing” seats, which could give him a majority. He even provided a list, which included Dewdney.
In Dewdney, news releases trumpeted a three-way race. “All our surveys indicate that at the present time the election is a toss-up in Dewdney”, announced the McDonald campaign. “People are dissatisfied with the high-handed, arrogant practices of the Social Credit government.”

McDonald brought in legendary newspaper editor Ma Murray for a rally late in the campaign, garnering a strong turnout in Haney. Not only did Ma entertain the crowd, she held court at the McDonald household until the wee hours of the morning regaling supporters with her stories while enjoying her drinks.
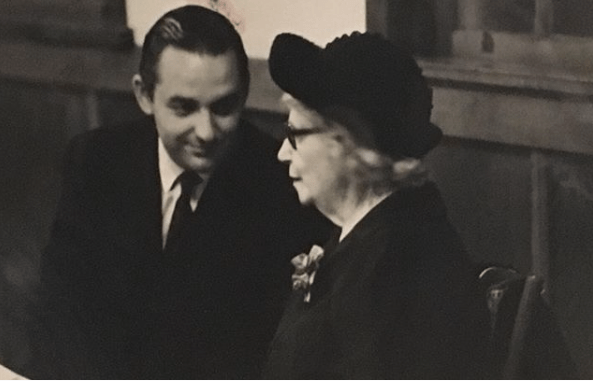
McDonald and legendary news editor Ma Murray (Haney, 1969)
The after-party with Ma Murray, which lasted into the wee hours of the morning. Ma with promotional posters distributed by campaign volunteers Julia & Sylvia McDonald
The Liberal pitch was that the Socreds couldn’t last forever and a Liberal alternative was needed to keep the NDP out of power. Said McDonald, “Mr. Bennett’s present campaign policy, if successful, would put an NDP government into office in the election after this one.” He was right. But in the meantime, the message wasn’t getting through.
One example of the Socred grip was a generous donation McDonald received from a small businessman. However, not long after, he saw the same man leaving the office of George Mussallem, where he had given an even larger donation. When challenged as to which campaign he was supporting, the small businessman remarked, in effect, “Pete, you’re a nice guy, but you’re not going to win.”
And the water pollution issue that McDonald was making as a centrepiece of the campaign? The Socreds had thwarted him before the campaign even started. The source of the pollution identified, dealt with, and proclaimed safe, with a helpful front page letter to the editor from the local MLA.

In the outback, Liberals were realistic. In his book, Bill Bennett: A Mandarin’s View, Bob Plecas wrote about his experience as a 24-year old Liberal candidate in Nanaimo. He said he was told by the local newspaper that no matter what he did, including “standing on his head to give answers at all-candidates meeting”, he would get no coverage.
In the final analysis, Plecas said he had more relatives than votes. One headline he did receive in the Nanaimo Daily Free Press was, “McGeer’s Election Tour to Bypass Nanaimo.” McGeer would make it to Nanaimo late in the campaign.
The Final Week
In the homestretch, W.A.C. was returning to his core theme: “NDP Menace to Liberty”. While campaigning on the Sunshine Coast, W.A.C. took on the labour bosses: “It will be a dark day when the workers of this province follow their bosses on political things… I appeal to the union wives. Do you want the good wages you’re getting now? Or strike pay with Berger? Because there will be chaos.”
Berger was promising to develop a rapid transit system for Vancouver and the Lower Mainland over a new Burrard Inlet crossing. He wanted commuter trains running on existing rail tracks, and BC Hydro (which then ran the bus system) to begin planning a subway system. At an Island rally, Berger promised public auto insurance.
With four days to go, a Canadian Press story quoted W.A.C. as saying, “This is not a campaign. This is just the tour of the province; I’m just a tourist.” He said he was enjoying the campaign “more than any other I’ve ever been in”.
In a separate CP news item, Berger was, again, responding to W.A.C.’s attacks. This time, W.A.C. had said an NDP victory would be like the Russians invasion of Czechoslovakia. Berger called the attacks “absurd.”
Berger pressed on with more campaign planks. On August 25th, he promised a new housing fund to provide first mortgages for home buyers at lower than federal CMHC interest rates.
Berger spoked at a rally of 7,000 in New Westminster. He said, “We’re ready to form a government. I’m calling for unity. I’m calling for mandate. I’m calling for victory.” Manitoba Premier Ed Schreyer voiced his support for Berger and noted that Manitoba has had a publicly-owned telephone company since 1912.
Vancouver Centre candidates Herb Capozzi and Evan Wolfe joined 250 of their campaign volunteers to build a playground at a low-rent housing project in their riding, with donated material. An interesting tactic in a close race.
On the eve of Election Day, Canadian Press reported that election strategists for the three parties were reconciling themselves to a potential minority government. All parties publicly predicted majorities.
Election Night
It was a resounding win for W.A.C. and the Socreds and a crushing loss for the NDP. While not totally unexpected, the Liberals’ optimism was dashed.
Social Credit 46.8% (+1.2%) 38 seats (+6)
NDP 33.9% (+0.3%) 12 seats (-5)
Liberal 19.0% (-1.2%) 5 seats (-1)
The 69-year old premier not only secured a 7thmandate for the Socreds, he increased the popular vote and added six seats to assume a dominant position in the Legislature. He defied expectations. He said, “Our cup runneth over.”
While holding the popular vote, the seat count was a disaster for Berger, losing almost one-third of his Caucus, including his own seat. The Liberals were stymied and lost their only seat on Vancouver Island, Oak Bay.
In Dewdney, Socred George Mussallem cruised to an easy victory with 51% of the vote. NDP Stu Leggatt took 37% while Liberal Peter McDonald accounted for 12% of the votes.
Front page headlines:
Vancouver Sun: Socreds Flatten Opposition
The Province: Bennett tightens his grip
Victoria Daily Times: Landslide Win for Bennett
Another Vancouver Sun A1 piece was headlined 7 Straight for Old Master. Sun reporter Dave Ablett writes, “The old man has run out of ideas, they said. And his anti-socialist extremism seemed totally out of place in the sophisticated 60s.” However, according to W.A.C.’s son, Bill, “My father said two weeks ago that it was the easiest campaign he’d run.”
After the Campaign

Tom Berger (UBC.ca)
At age 36, Tom Berger was done with party politics. Without a seat, he resigned he party
leadership and essentially turned it over to Dave Barrett. Three years later, Barrett would be the premier, decisively defeating W.A.C. Bennett. He ran a very different campaign than Berger, focusing on opposing not governing, and using humor to disarm. Berger continued in law, as lead counsel for the Nisga’a in the historic Calder case, went to the bench, and has enjoyed a celebrated legal career receiving many accolades.
Many NDP candidates who lost in 1969 would be successful in 1972, such as Dave Stupich, Emery Barnes, Bill King, Harold Steeves, and Norm Levi. NDP candidate William Deverell went on to become one of Canada’s best-known novelists.
Pat McGeer continued on as Liberal leader initially, but by 1972 he had stepped away, to be succeeded by David Anderson, then a first-term MP from Victoria. With Anderson, the Liberals regressed. Ultimately, McGeer, his seatmate Garde Gardom, and West Vancouver MLA Allan Williams would cross the floor to the Socreds and join W.A.C.’s son W.R. Bennett for the 1975 campaign, where the Barrett government was defeated. The troika of erstwhile Liberals played senior roles in the younger Bennett’s cabinet. Gardom went on to be Lieutenant-Governor, McGeer continues, with his wife, as an esteemed medical researcher at UBC.

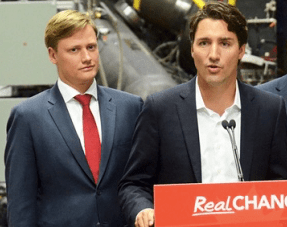
W.R. Bennett (2nd from right) with his troika of Liberal MLAs (L to R): Allan Williams, Pat McGeer, and Garde Gardom (Vancouver Sun, 1974)
Liberal candidate Bob Plecas (Nanaimo) would enter the public service and play a major role in the senior ranks for decades. Victoria-area Liberal candidate Mel Couvelier would go on to serve as BC Liberal Party president and Mayor of Saanich, but would ultimately gravitate to the Socreds, running for the leadership in 1986 and served as Finance Minister. Cariboo David Zirnhelt would return to politics as an NDP candidate in the 1989 Cariboo byelection, scoring a major upset over the Socreds, a major event for the NDP on the way to victory in 1991. He served as senior cabinet minister in the 1990s.
1969: Changing the course of BC politics
The 1969 campaign had two significant impacts.
First, it changed the NDP. Berger’s divisive leadership campaign, which consumed most of the 1966-1969 period, was all for naught. The outcome put the party in Dave Barrett’s hands, who would lead the party in the next four elections – significantly, winning the first in 1972. Under Barrett, the NDP reached record levels of popular vote.

Barrett’s 1969 brochure
Second, the ’69 campaign had a major impact on the Liberals too. The loss of a seat, and modest dip in popular support were big disappointments. The futility of trying to win as a free enterprise alternative was reinforced in 1972. Within five years of the 1969 election, three Liberal MLAs, including McGeer, dramatically crossed the floor to the Socreds.
In reality, the Liberal formula was flawed. They had not broadened their appeal beyond the “silk stocking” seats of Vancouver and Victoria and lacked a populist appeal. McGeer, an “egghead,” embodied the traditional Liberal base, which Liberals failed to break out of federally or provincially for a generation.
It wasn’t until Gordon Wilson channeled W.A.C. by running against the elites that the Liberals returned to prominence in British Columbia. Gordon Campbell reconstituted the coalition against the ‘Marxist socialists’ that had defined B.C. politics since 1941.
Then there are the little things. In the 1968 Oak Bay byelection, W.A.C. sought the election of a Socred in a seat held by the Liberals for many years. At a rally at Oak Bay High, W.A.C. pleaded, “How many years does a premier have to wait?” Socred Peter Pollen (future mayor of Victoria) was defeated by Oak Bay mayor and Liberal candidate Allan Cox. One year later, Socred candidate Dr. Scott Wallace defeated Cox in what Pat McGeer called “the biggest upset” of 1969. It was certainly upsetting to him.
However, it would soon upset W.A.C. One of only 38 MLAs, Wallace was a mere backbencher and his ideas for health care reform were shot down by the government. By 1971, he had crossed the floor to the Progressive Conservatives, giving them their first MLA in 15 years. Combined with a new, vigorous leader, the Progressive Conservatives would help destroy the Social Credit campaign in 1972. In the end, W.A.C. may have wished Oak Bay voters had waited a little longer.
Thus the stage was set coming out of 1969 for both a stronger NDP and reaction to a stronger NDP – a realigned and consolidated free enterprise movement. By 1975, Barrett had already been premier, and W.A.C.’s son, Bill Bennett, was about to begin, with the former leader of the Liberals at his side.
A candidate’s ending
Like many candidates, Peter McDonald gave it his best shot. “You can’t win if you don’t run” is an argument I have certainly used while recruiting candidates over the years – and his possibilities were much better than other longshot bets that did pay off (like the Liberals in 1991).
And like many candidates, he got it out of his system; he never ran again.
Disappointment at the result, sure, but there’s nothing he could have done. The Liberal opportunity to win in Dewdney would have seemed hopeless after the 1969 campaign – and it was for a generation.
It was the discovery of a box of election materials in the basement that sparked my interest in politics. I could not begin to understand the lists, brochures, and newspaper clippings. It was like another world, one that I would fully embrace once I began to comprehend.
It was a tremendous benefit to me as a young person starting out in politics to have had a father that ran for office, without much chance of winning, but running out of passion and purpose. Much like it was for my friend, Christy, whose dad, Jim Clark, also ran for the Liberals during that era.
As I reflect back on campaigns past, it’s also a reminder that candidates make contributions, even if they don’t have a chance of winning. They drive issues. They hold the leaders accountable. It’s a noble endeavor to run when you are likely not going to prevail.
A further example I took from this campaign was the collegiality. While I was only eight months old during the 1969 campaign, in later years I would often hear my Dad speak about George Mussallem and Stu Leggatt. They were friends. He had a deep respect for both. Despite the polarization and rhetoric at the leadership level, at the local level, there was mutual respect.
Late in the campaign, Dad was going down to defeat. On what I imagine was a sunny August day, he set out to knock on doors on Nicomen Island, a farming community east of Mission. He was greeted like a hero. It seemed like no one had ever bothered to visit farming families there before. He was welcomed into homes for tea and cookies, there were back slaps, and a feeling that support had been won.
On election night, as dismal results flooded in, McDonald leaned over to his brother Harold and said, “Just wait for Nicomen Island to come in.”
Well, the good people of Nicomen Island overwhelmingly voted Socred that day, saving only one vote for McDonald.
Nice guy, that Peter McDonald, but it seems those Nicomen Islanders were enjoying The Good Life and sure as hell didn’t want any Marxist Socialists.
At least, that’s the story I heard.
(Originally published in The Orca)
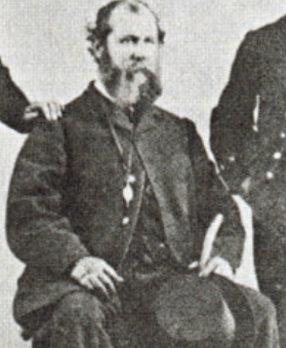

 took months and numerous members of the crew deserted to take part in the California Gold Rush. Thus, son James was born at Fort Vancouver on the Columbia in 1851. Dunsmuir’s uncle worked for the HBC in Nanaimo and there he went. When his uncle’s contract expired, he tried to convince Robert and his family to return to Scotland. They decided against it and stuck it out in Nanaimo.