Unknown's avatar

Posts by Rosedeer

Mike is a communications and public affairs consultant based in Vancouver. He is a former Chief of Staff and campaign manager for the Premier of BC. He's a lifelong British Columbian with a passion for his province. Online: @BCMikeMcD and https://www.linkedin.com/in/bcmikemcd

In Alberta, the Oranges are crying the Blues

Wildrose + PC = Federal Conservative voters in Alberta, right?

Actually, it’s Wildrose+PC plus plus plus

Will the big bloc of federal blue voters drive over the Alberta NDP next election?

A few surprising things about the federal election in Alberta:

  • Almost a half-million more people voted in the federal election, compared to the May 2015 provincial election
  • Despite their huge win in May, the NDP lost votes compared to their previous federal effort in 2011, including a significant drop in ‘market share’
  • And the most surprising to me – the federal Conservatives had 375,000 more votes than the two ‘conservative’ provincial parties (PC and Wildrose) combined.

Chart: Comparing the 2015 Alberta provincial results to 2015 Alberta federal results in TOTAL VOTES.  Note: Wildrose and PCs combined and compared to federal CPC.

Alberta 2015P 2015F

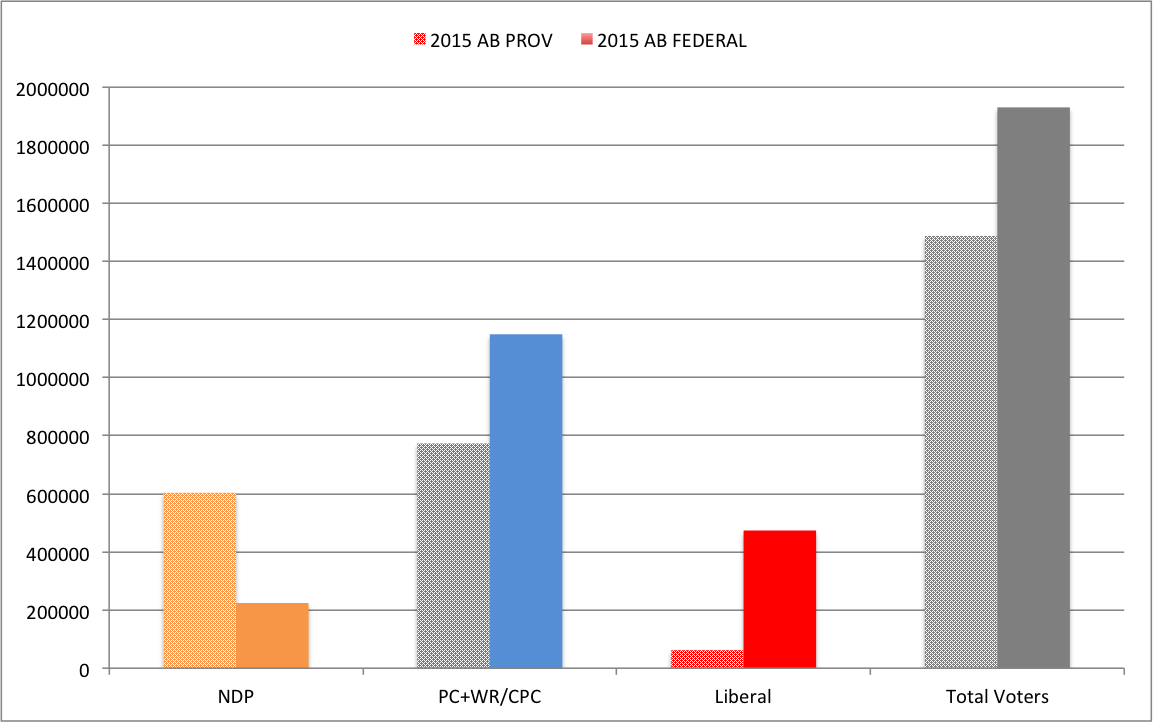
For those who prefer the raw numbers:

Provincial Party 2015 AB PROV Federal Party 2015 AB FEDERAL Difference
NDP 603,459 NDP 224,198 -379,261
PC + Wildrose 773,082 CPC 1,148,649 375,567
Liberal 62,171 Liberal 473,661 411,490
Total Voters 1,486,901 Total Voters 1,929,197 442,296

So, 442, 296 more Albertans voted in the federal than the provincial, despite the fact that the Alberta provincial election was a once-in-a-generation change.  These ‘new’ voters didn’t necessarily march to the polls to trounce Harper – there was a bit of that – but many may have been small ‘c’ conservatives sitting out the provincial election.  While the provincial turnout was higher than normal at 58%, the federal turnout this month was 69%.

Comparing Alberta federal results: 2011 to 2015

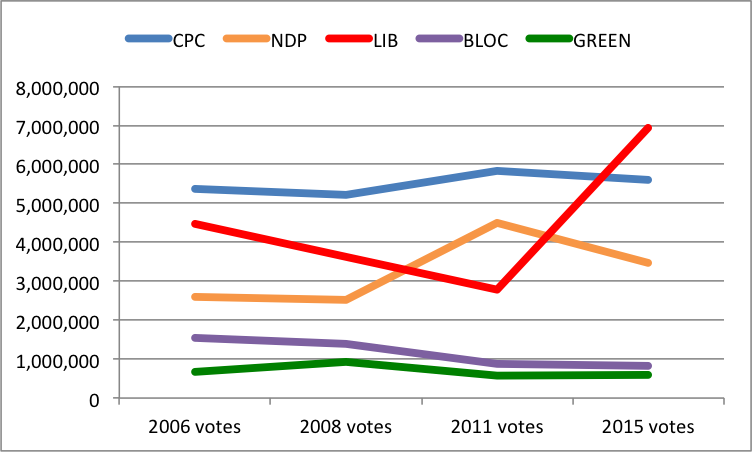
Leaving the May 2015 provincial election aside for a moment, both the Conservatives and Liberals made gains in total votes, while the NDP was flat.  Because turnout was much higher, the NDP and Conservatives lost market share while the Liberals went way up.

Chart: Comparison 2011 to 2015 federal results in Alberta by VOTES

ab 2011 2015

Chart: Comparison 2011 to 2015 federal results in Alberta by market share

ab 2011 2015 %

The Liberals go way up in votes and market share; the Conservatives go up in votes and down in market share; and the NDP are flat in votes and go down in market share.

What does it all mean?

Well, you gotta be dispirited if you’re an NDPer.  On the surface, it makes the May 2015 results look very fleeting and surely there were hopes last May of a “Quebec-Alberta bridge” that could have delivered a federal NDP win, a’ la Mulroney 1988 and many PMs in the past.

Don’t despair, orange friends.  When you look at it a little deeper, a combination of federal NDP and federal Liberal voters makes for a significant voting bloc, one that is larger than the NDP vote from last May.

It’s a salivating prospect for non-NDPers in Alberta to consider how to harness the power of the federal Conservative voting bloc.  It remains the most dominant political base in the province, but has been divided provincially in recent years.  Also, just because some Notley voters would have voted CPC doesn’t mean they won’t return to Notley next election.

Governing well is the key to success for Premier Notley.  She will need to try to not awake the Beast – those million-plus federal Conservative voters.  She cannot do much to keep the conservative base from unifying – that’s on them, and it won’t be easy given the cultural differences at the provincial level between PCs and Wildrose.

On her end, she will be very keen to unite ‘progressive’ voters and appeal to those 473,661 federal Liberal voters that were energized by Justin Trudeau,  most of whom residing in Calgary and Edmonton who largely voted for her last May.  Putting all her eggs in the NDP-brand basket is a non-starter in Alberta.

The Premier of Alberta making nice with a Prime Minister named Trudeau… now that would be something.

Related:

 A panel discussion of the Alberta election hosted by the Broadbent Institute

Conservatives held their vote but lost market share

Did the Conservatives crash?

No. They had 96% of the votes they received when they won a majority in 2011.  Had the number of voters stayed the same, they would have received 36% of the popular vote.

However, the market expanded.  An additional 2.7 million Canadians voted, pushing voter turnout from 61.1% to an estimated 68.5%.

Chart: Total votes by party from 2006 to 2015

2006 2015 votes

The blue line is remarkably consistent over four elections, ranging from a low of 5.2 million (2008 minority CPC government) to 5.8 million (2011 majority CPC).  The total number of CPC votes in 2015 was higher than minority governments in 2006 and 2008.

The absolute number of votes for the Greens has declined and levelled off.  The Bloc continues its decline in overall voters.  More seats this time, but that was thanks to a four-way fight in Quebec.

The NDP can take some solace that they had the second most votes in the history of their party, almost a million more than Jack Layton’s campaigns in 2006 and 2008, but over a million less than the breakthrough 2011 campaign.

Then there’s the Liberals.  After successive declines, 2015 blew the roof off of their support eclipsing the steady Conservatives.

On the surface, the 250% increase in Liberal support can be attributed to stealing market share from the NDP but moreso in terms of increased voter turnout overall.

Five BC ridings where strategic voting organizations got it wrong… and other monkey business

One reason why political party organizers don’t like strategic voting organizations is that they are likely to get it wrong when it comes to polling.

In five BC ridings, they did just that.  In two of those ridings, a Conservative was elected.  In three other ridings, they picked the NDP and the riding went Liberal in close three-way battles.  They could have screwed those up too, if their aim was really to “STOP HARPER”.

Cariboo-Prince George

Leadnow recommended NDP Trent Derrick based on Environics polling.  He finished third.  Final result: CPC 36.5%; Liberal 31.6%; NDP 25.9%.  Oops!  As of October 9-11, they had the Conservatives at 30% – they finished with 36.5%.  I guess it was that late Blue surge?

North Okanagan – Shuswap

Leadnow recommended NDP candidate Jacqui Gingras.  Again, it was the Liberal who had the best chance to win.  CPC candidate Mel Arnold won with 39%, with the Liberals second at 30% and NDP at 26%.  Yet the Environics polling had it at 37% NDP and 33% CPC, while Leadnow also published poll results from a firm called Oracle that had the Liberals at 12%!  They messed up and got it wrong.

Here’s three seats that the Liberals won despite inaccurate and confusing poll data indicating otherwise:

Burnaby North – Seymour

Liberal Terry Beech won the seat with 36.2% of the vote, winning by about 7 points.  Leadnow reported that the Liberal had the best chance, but on October 15th, Dogwood released a stale poll from Insights West (Oct 5-10) that had the Liberals third at 17%.  Wrong call, bad polling, and, frankly, reckless.

Coquitlam – Port Coquitlam

Leadnow recommended NDP candidate Sara Norman and released poll results (Environics, Oct 9-11)  claiming she led the race with 38%.  Well… turns out the Liberals won the dang seat and the NDP were third.  Libs 35%; CPC 32%; NDP 27%.

Pitt Meadows – Maple Ridge

The riding I grew up in – it hadn’t elected a Liberal since they lost to the federal Socreds in the 1950’s!  Until yesterday.  Leadnow promoted a September poll that had the NDP at 41% compared to the Liberal at 19%.  Might have been true… then.  Election night?  Liberals 33.8%, barely edging the CPC at 31.4%, with the NDP pulling up third at 29.6%.  Close shave.

Other controversy…

The Vancouver-Granville brouhaha has been well documented.  Leadnow endorsed NDP Mira Oreck.  From the standpoint that they had written off the Conservatives, they were correct.  Liberal Jody Wilson-Raybould won the race handily, as predicted, but Leadnow left a lot of people confused as to their definition of strategic voting.

The Leadnow website simply listed the NDP MP in Surrey-Centre as the choice.  From the standpoint that the CPC were out of the running, they were correct, but it was the Liberal Randeep Sarai who won.  The same almost happened in Burnaby South where up-and-comer Liberal Adam Pankratz almost nipped off NDP MP Kennedy Stewart, who was promoted on the Leadnow website. These examples are not such a big deal but Liberals might feel a little peeved.

What’s the point?

Five ridings is a lot of ridings to get wrong.  They basically played into the hands of the Conservatives, and helped elect two of them by sending mixed signals.

I’m sure there are some chagrined Liberals who saw the endorsements or promotion of the NDP undermine their more legitimate chances of winning.

As well, the polling that was done by Dogwood lacked transparency.  They did not release cross-tabs to the public, which should be common practice for all publicly released polls.  I will credit Kai Nagata of Dogwood for opening a dialogue on polling issues and stating that they are going to learn from the experience.  We’ll see.

My advice:

Releasing polling data is very risky unless you are committed to doing it right.  Doing it right is NOT doing it on the cheap nor is it doing it well before voters have made up their minds.  Of course they were wrong!  The Liberals surged and rendered their polling info useless except for the fact it served to mislead voters as to who had the best chance.  Why they were polling in May and over the summer, I will never know.  They simply wasted their donors’ money and misguided their own strategy.

Too Close To Call seat model was close enough in BC

One of the more interesting election websites is “Too Close too Call” – an election forecast site produced by Bryan Breguet, a Ph.D student in Economics at UBC.  I haven’t met him but admire his work.

It seems like he’s beating himself up a bit about his predictions today.  I took a spin on his seat forecasting model and inputted the actual popular vote numbers from BC.  His model extrapolates the final results fairly accurately.  Seat forecast models basically extrapolate the new pop vote numbers on a platform of the previous pop vote numbers (2011).

Here is the result:

Screen Shot 2015-10-21 at 2.05.47 PM

His accuracy is 81% (34 out 42).  Not bad.  That’s a B in most schools.

What interests me are the differences – why do some ridings break the pattern?

In BC, those eight ridings – based on Too Close too Calls model – are:

  • Cloverdale-Langley City
  • Coquitlam-Port Coquitlam
  • Kelowna – Lake Country
  • Kootenay-Columbia
  • Mission-Matsqui-Fraser Canyon
  • Pitt Meadows-Maple Ridge
  • Richmond Centre
  • South Surrey-White Rock

I will offer a theory:

  • These were all CPC seats to begin with
  • Five of eight seats did not have an incumbent seeking re-election.  (Conservatives lost 4 of 5 with new candidates)
  • The Conservatives won two of the seven outliers
    • Richmond Centre – bucked the trend for the CPC because of incumbency advantage.  Possibly retaining stronger support among Chinese.
    • Dianne Watts bucked the trend in South Surrey because she was a much better candidate for CPC than her predecessor.
  • Kootenay-Columbia was going to be close under these circumstances, though the NDP outperformed there, defeating a CPC incumbent in a squeaker.
  • Kelowna-Lake Country was a Liberal surprise, perhaps reflecting changing demographics in BC’s most urbanized Interior City.

Candidates make a difference, especially incumbents.  A closer look at popular vote per riding based against the model would show this too, but it’s the winning and losing that matters most.

Magnitude of Liberal gains highest in 4 western provinces

By order of magnitude, the biggest Liberal gains were in the four Western provinces.

Liberal popular vote increased by 2.6X to 2.8X in each of the four western provinces.  Nationally, the Liberal vote doubled.

Lib magnitude provinces

Sk 2.8
Mb 2.7
Ab 2.6
BC 2.6
Que 2.5
NB 2.3
NS 2.1
Ont 1.8
Nfld 1.7
PEI 1.4
National 2.1

Popular vote increases:

2011 2015 DIFF Magnitude
Sk 8.6% 23.9% 15.3% 2.8
Mb 16.6% 44.6% 28.0% 2.7
Ab 9.3% 24.6% 15.3% 2.6
BC 13.4% 35.2% 21.8% 2.6
Que 14.2% 35.7% 21.5% 2.5
NB 22.6% 51.6% 29.0% 2.3
NS 28.9% 61.9% 33.0% 2.1
Ont 25.3% 44.8% 19.5% 1.8
Nfld 37.9% 64.5% 26.6% 1.7
PEI 41.0% 58.3% 17.3% 1.4
National 18.9% 39.5% 20.6% 2.1

Trudeau’s voter coalition stronger in BC and MB than Chretien’s 1993 win

The last time the Liberals defeated an incumbent Conservative government was in 1993.

Jean Chretien’s Liberals took 41.2% of the vote compared to Justin Trudeau’s 39.5%.  Similar.

The regions tell an interesting story.  Justin did 6.4% better in BC than Chretien, 9.9% better in Nova Scotia, and 10.3% better in Manitoba.  Chretien was higher in Ontario and Quebec (marginally).

In terms of BC, Chretien took six seats in 1993; Trudeau took 17 in 2015.

Chart: Comparison of Liberal Popular vote by province – 1993 and 2015

1993 2015 LIB

1993 2015 DIFF
BC 28.8% 35.2% 6.4%
Ab 24.0% 24.6% 0.6%
Sk 24.7% 23.9% -0.8%
Mb 34.3% 44.6% 10.3%
Ont 49.5% 44.8% -4.7%
Que 36.7% 35.7% -1.0%
NB 56.0% 51.6% -4.4%
NS 52.0% 61.9% 9.9%
PEI 60.1% 58.3% -1.8%
Nfld 67.3% 64.5% -2.8%
National 41.2% 39.5% -1.7%

Lib win ‘over’ the over-under line

I wrote about the Over-Under line for majority and minority governments back on October 1st.

No government has won a majority with less than 38.5% of the popular vote in the past 60 years.  One government (Pearson) had a minority with 41.5%, so the over-under line was described as 38.5% to qualify for a majority and 41.5% to guarantee it.

The Liberals led by Justin Trudeau garnered 39.5% of the popular vote, falling within the range of many other majority governments in Canadian history, garnering the seats without needing to cross the 41.5% threshold.

Slide1

First Nations representation: following in Len Marchand’s footsteps

In 1968, Len Marchand became the first “Status Indian” to be elected to the Parliament of Canada, from the riding of Kamloops.  He went on to become the first to be a member of the federal cabinet as well.

Screen Shot 2018-04-20 at 2.57.05 PMOnly eight years before, Len – along with all Status Indians – was ‘granted’ the right to vote by the Parliament of Canada.

1960.  Can you believe that?  That’s not that long ago.

Prime Minister John Diefenbaker was in power.  His government took action where previous Liberal and Conservative governments had not.

An agronomist by training, Len’s political activism led him to elected office in 1968, 1972, and 1974 as a Liberal.  He was swept out in 1979 when the Liberals were defeated.  He was the last federal Grit to be elected from the BC Interior.  We’ll see if that changes tonight.

To my knowledge, Len was the last First Nations person to be elected from BC as well.  41 years ago. (note: I’m distinguishing First Nations from Metis)

This election, there are First Nations candidates that could take a seat in Parliament from BC.  Here’s a list of all aboriginal candidates in Canada for each party.

Jody Wilson-Raybould stands an excellent chance of being elected from the riding of Vancouver-Granville.  A lawyer, former Crown Prosecutor, and former Regional Chief for Assembly of First Nations.

Trent Derrick of the NDP appears to have a solid chance at the riding of Cariboo-Prince George.  The NDP have two other First Nations candidates – Carleen Thomas in North Vancouver and Kathi Dickie in PG-Peace River-Northern Rockies.  Thomas and Dickie are longshots to win.

The issue of why there are not more First Nations elected from BC to the Parliament of Canada and the BC Legislative Assembly is a topic for a future blog post, one that I intend to take on properly after the election.  Len and others have done a lot of work in this area and, this election, there is increased advocacy from indigenous groups compared to previous elections.

When one looks at the career of Len Marchand, you realize the tremendous potential for First Nations perspective to inform federal and provincial decision-making.  While this insight is presented in other forums and bilaterally from First Nations to government, having that insight on the floor of the House, in the caucus room, and at the cabinet table is something that would strengthen our parliamentary institutions.

Postscript:

Len’s book “Breaking Trail” is a great political bio and record of an era of politics from the 1960s through the 1990s.

To predict, or not to predict …

Let’s start my election prediction with a little bit of Hamlet:

Now whether it be
Bestial oblivion, or some craven scruple
Of thinking too precisely on th’ event—
A thought which, quarter’d, hath but one part wisdom
And ever three parts coward—I do not know
Why yet I live to say this thing’s to do,
Sith I have cause, and will, and strength, and means
To do’t.

In other words, I’m pretty sure I am overthinking this election!

I have written about many aspects of polling over the course of this election and will apply them to what we may see tonight.

I’m going to borrow from the poll aggregator 308 to show the trends in this election and the aggregated outcome.  The Liberals separated from the NDP around September 20th and never looked back while the Conservatives held steady but never able to grow their market share (according to the polls).

Screen Shot 2015-10-19 at 10.48.24 AM

Polls schmolls.  They are often wrong.  Even the blended numbers provided by the aggregators  have been wrong time and again.

Here are factors I apply to these numbers:

  • Turnout by age – older people vote at a higher level.  This is a traditional Conservative advantage.  Some polls (EKOS, ANGUS REID INSTITUTE) show an age advantage, but others (NANOS) are showing the Liberals with big gains among seniors.  Moreover, with increased voter turnout, which is likely to happen this election, the proportion of seniors as an overall share of the electorate will likely drop.  It will still be significant and have the highest turnout rate, but the gap between seniors and younger voters won’t be as dramatic.

Screen Shot 2015-10-19 at 10.56.07 AM

  • Shy ConservativesScreen Shot 2015-10-12 at 11.08.00 PMwe saw this in spades in the UK where no one detected a David Cameron majority.  All the polls suggested ‘Hung Parliament’ yet the Cameron Conservatives triumphed in stunning fashion.  Part of this may relate to “won’t says” – the estimated 8% of voters who just won’t cooperate on surveys when asked the ballot question.  My view is that they probably skew Conservative.  There is also a theory that people stick with the incumbent and “hold their nose” if they are fearful of the alternative.  In BC, we used to call them “10 second Socreds”.
  • Cultural Bias – My view is that media polling does not accurately reflect Canada’s diverse multicultural population.  Those who struggle with English are much less likely to cooperate in a telephone, IVR, or online panel.  In fact, online panels are the least representative, culturally speaking, unless they are done in-language.  There can be major differences in perspective culturally and they, ideally, should be reflected in polling.  I wrote about this recently with regard to the Chinese-Canadian community.  In BC, Chinese make up about 10% of provincial electorate and about 20% in Metro Vancouver – a huge factor.  My view is that the under-representation of Chinese in BC likely means Conservative support is under-represented.  I have seen no data in this election that tells us what’s going on in this community specifically.
  • Ambivalent respondents –

    Some survey respondents really don’t have a clue… and some still use flip phones!

    Innovative Research Group has done interesting research on those who answer survey questions.  There is a continuum between strongly consistent to strongly ambivalent.  The Conservatives do better among consistent respondents (ergo likelier voters) and weaker on ambivalents.  Angus Reid Institute had similar findings along the lines of vote firmness.  See my post on “Why Conservatives have hope”.  Liberal support has been growing among consistent respondents.

  • Gut – What does the tummy feel?  Hamlet would have had a real quandary figuring out these poll results.  The problem with the gut is that has a built in bias based on the echo chamber it lives in.  I am wondering if I’m drinking too much of my own bathwater, but my gut is pulling me in directions based on conversations with family and friends, and seeing indicators that may show how voters are behaving that are not reflected in the polls.  A big gut check is momentum.  That is something that Nanos has detected in the final three nights of polling.  Liberals on the rise.  Is it real?  I’m consulting my gut.

When I think about election surprises over the past few years, I’m comparing this election to those.  What is lacking in this election for the incumbent Conservatives is an overall narrative that gives voters a positive vision.  Negativity is an important part of campaigns – or you can call it contrast.  Parties are fighting over market share and the market has a ceiling of 100%.  It’s a zero sum game.  Parties must contrast themselves from their competition.  I have no problem with that and you can go back to the 1800’s for examples that would make today’s ‘attacks’ pale by comparison.  However, there must be a either a strong vision for the future, a stark choice, or a sense of renewal and change.

In both Alberta 2012 and BC 2013, these were female premiers in their first general election.  They were new, different and both were offering a proposition to voters.  In Alison Redford’s case, she was contrasting against a more conservative Wildrose brand and she was proposing to address issues on the progressive side of the ledger.  Christy Clark put forward an economic vision based built on a platform of fiscal responsibility that contrasted sharply with the NDP.  In the UK, David Cameron morphed fear of the Scottish Nationalists and the perceived weakness of the UK Labour leader to drive English Liberals to the Conservatives.  The reasons, in hindsight, are apparent for those election surprises.  I don’t see it here.  The case for Conservative re-election has seemingly slipped away over the last week.  While it may have been too late in the campaign to change much, the Ford family-Stephen Harper photo op on the weekend may have provided an added push for “time for change” Tories to jump ship.

The Upshot

While there are many factors – turnout, cultural, and polling bias – that mitigate in favour of a better Conservative outcome – which I am accounting for, my gut pulls me in the other direction.  I believe “red Tories” and soft NDP voters are going Liberal and the polls are seeing a glimpse of that.

Prediction

I’m throwing away the calculators and the models and the spreadsheets.

Hearkening back to Hamlet, three parts cowardice, one part wisdom would have led me to predict a Liberal minority.  I have put aside the cowardice and perhaps the wisdom, and decided to be bold.

I don’t think Canadians are going to be wishy washy tonight.  I think it’s a Liberal majority… by a hair (which would be ironic… “nice hair” they’ll say).

And though 38.5% has been the minimum to attain a majority in past 60 years, I think the Liberals may do it with less this time because of the vote splits.

The math for the Libs:

Atlantic and West/North:  50 seats

Ontario and Quebec:  120 seats

Libs 170

In BC, I think the NDP have jumped the shark.  Bringing out warhorse Stephen Lewis, last seen promoting the Leap Manifesto, to stump shows they are doubling down on their core vote.  The Liberals are going to win some seats that no one, including them, thought they had any business of winning.

BC seat count:

Libs 15

CPC 14

NDP 11

GREENS 2 (yes, not sure if it’s Victoria or Nanaimo)

This post will not impact a single vote so it’s all just fun and games.  When we are sitting around tomorrow reading about a shocking Conservative win, I will begin my tour of shame with my Conservative friends who will no doubt remind me of this post forever more.