Can Hillary lose? Not easily.

For some months I have sounded the alarm bells that Donald Trump could win the presidency in spite of breaking every rule of conventional politics.  Every time I second guess that opinion, he roars back with another lunge to the throat of the Clinton campaign.

Map: RealClearPolitics “no toss ups” map (October 31)

Screen Shot 2016-10-31 at 9.18.36 AM.png

Today, RealClearPolitics has it at 304 Clinton, 234 Trump.  This is a significant improvement for Trump over last week.  Nate Silver has upped his odds of a Trump win to about 1 in 5. But of course, this is based on polling data – and there is a litany of polling debacles in recent years.

So what does the map need to look like for Hillary to lose

  • Trump needs to hold all Romney states

Mitt Romney had 206 electoral votes (with 270 required to win).  Right now, Clinton is leading in North Carolina and Arizona, where Romney had prevailed.  If Clinton, holds the lead in those states then Trump is almost certainly finished.

  • Trump needs to add 64 electoral votes from Obama states.

Trump has consistently led in Ohio, which Obama won twice.  That’s 18 votes.  He is close in Iowa (6) and, now, RealClearPolitics has a GOP advantage in Florida (29).  There’s 53 new votes combined.  He may pick up one vote in Maine (1) where it’s one of two states that is not a winner-take-all state.  When added to Romney totals, that’s 260.

The final 10 votes are the hardest.

  • The next closest state would be Nevada, which only has 6 votes, but add Colorado (9) and that puts Trump over the top.  Polling shows that both states are within 4 points.
  • Or, one of Pennsylvania, Michigan, Minnesota or Wisconsin.  Polling shows Trump about 6 points off in these states.

It’s not impossible, though it is unlikely. The polling shifts become less and less relevant due to early voting.  Trump leads in Florida but many Floridians have already voted, perhaps locking in a Clinton victory.  Secondly, Clinton has a much stronger ground game. That may make the difference alone.  But Trump supporters have zeal which is a hard thing to measure.  He has defied conventional wisdom and we don’t know how bad (or good) the upcoming week will be for Clinton.  Just when I thought Trump was finished, he continues to haunt this campaign.

Obama campaign manager David Plouffe says not to “fret and wet”, that Hillary has a solid 300 votes, and that there is a 100% chance she will win.  So there’s that.

Table 1: Trump pathway to 270

Screen Shot 2016-10-31 at 11.36.38 AM.png

Holding Romney states (tall order) plus winning states (and districts) where Trump currently leads in the polls equals 260 votes.

Hillary is in a strong position but it is uncomfortably close.

And finally, for reference…

Table 2: US presidential elections since WWII

Screen Shot 2016-10-31 at 11.52.49 AM.png


1991: The election that transformed BC politics

British Columbians went to the polls on October 17, 1991 and changed BC politics in more ways than one.

It was the election of Premier Mike Harcourt’s NDP government and only the second time in BC history that the NDP had gained power. The election was hugely significant for the NDP as they governed for a decade. But its longer-term impact was the realignment of the free enterprise vote in BC.

oct-17-1991-liberal-leader-gordon-wilson-on-the-campaign.jpg

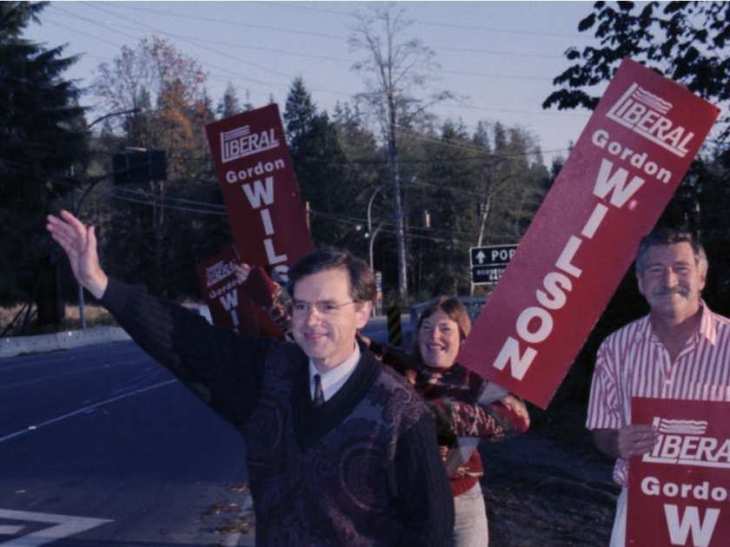
Gordon Wilson, BC Liberal leader in 1991 breakthrough election.

The Social Credit Party had governed for 36 of the previous 39 years, mostly with a Bennett at the helm. It had renewed itself during the first NDP term of office in the 1970s and emerged stronger under WR Bennett with a broader base of support. Bennett had revived the Socred coalition by attracting Liberals, Conservatives, and even an NDP MLA to run with him in 1975. The renewed coalition was maintained for three elections (1975, 1979 and 1983) in the most polarized elections in BC history. When the Social Credit chose a new leader in 1986, they chose Bill Vander Zalm. While he led the Socreds victory one more time, their coalition would unravel under his premiership.

Starting in the early 1980s, a small group of Liberals worked to revive the provincial wing. From virtually no candidates in 1979, they ran close to a full slate in 1983 under leader Shirley McLaughlin, with parachutes attached to many Young Liberals. They garnered about 3%. Most federal Liberals (and they were a vanishing species at that time) were supporting the Social Credit Party.

Undaunted, Liberals held a leadership convention in 1984 where former Member of Parliament Art Lee, the first Chinese-Canadian leader of a political party in BC, defeated Stan Roberts, who would go on to help establish the Reform Party of Canada. Lee would build a strong relationship with Liberal Party of Canada leader John Turner, who represented Vancouver-Quadra, and BC’s Iona Campagnolo who was president of the Liberal Party of Canada.   “A Liberal is a Liberal is a Liberal” was a mantra I heard at my first political convention in 1985 as a keen 16-year old.

When Bill Vander Zalm called the October 1986 election, Art Lee fielded a team of candidates across the province. There was no TV leaders debate and little money so it was hard for Lee to make an impact. Rather, Vander Zalm’s charisma trumped NDP Leader Bob Skelly’s opening press conference flutter. The Liberals were squeezed out, but doubled their vote to about 7%. Hopes for a seat were dashed as they were shut out of the Legislature. Art Lee stepped down. On election night, BCTV cruelly reported that Art Lee was going to win his seat. Bedlam erupted at Liberal HQ. Out in Maple Ridge where I was stationed, we piled into cars and headed in for the ‘party’. Somewhere around the Sperling interchange, CKNW reported that someone had made an error and Art Lee was 5th! Cheers turned to tears at the Liberal election night party at the Plaza 500. I ran into my new friend Christy Clark there. We had joined the SFU Young Liberal Club that month.

By the time the BC Liberals got around to choosing a new leader on Hallowe’en Day 1987, there was only one candidate – Gordon Wilson. A political unknown to most, he had at least been elected to local office on the Sunshine Coast and put up a respectable showing there in the 1986 election. He was an outsider to the Vancouver-centric Liberal Party in BC. Yet he showed up and took on the mantle.

The focus for Liberals in BC during that time was federal politics with an election looming in 1988. While Wilson sought to get established, the Vander Zalm government started its meltdown. Ministers and MLAs would resign from cabinet and/or resign their seats. Around this time, a group of free enterprise supporters, mostly Liberals I think, sought to encourage Jack Poole (Chair of the 2010 Olympics) to take over the BC Liberal leadership as a response to the Social Credit implosion. While this is truly a story for another day, Poole would go through a due diligence effort, assisted by former leader Gordon Gibson, but ultimately decided not to seek the leadership. Gordon Wilson, who had reluctantly cooperated with the Poole potential candidacy, ventured forth unfettered when Poole left the scene. No one gave him much of a chance.

Wilson’s leadership in 1989 and 1990 could be described as persistent and tenacious, but also was met with setbacks. Byelection results were disappointing while the party was in a constant financial crisis. Federal politics intervened again as Jean Chretien succeeded John Turner in June 1990 after a lengthy leadership campaign.   One issue where Wilson and Chretien had common ground was over the Meech Lake Accord. Wilson was as a strong critic and aligned with Manitoba Liberal leader Sharon Carstairs and Newfoundland Premier Clyde Wells on the issue. This was a very divisive issue within the Liberal Party of Canada, but Wilson made a name for himself on this issue. However, the relationship with the Chretien team would become increasingly uneasy.

I was part of a group that believed, for some years, that the Party should split into separate federal and provincial political parties. The “BC Liberal Party” needed to be strictly provincial and put BC first on issues. During the Turner years, the party membership did not want to make the move, in part out of respect for Turner. However, by 1991, the provincial wing believed it was in their political interests, and the federal wing believed it was in its financial interests. At a convention in Spring 1991, the parties decided to split. This was a defining moment in BC political history. Had this not happened, the BC Liberal Party could not have emerged as a “big tent” political party. It was hard enough to attract non-Liberals to the BC Liberal Party in the 1990s, but it would have been impossible if the provincial party was not independent.

There is no greater boost for an opposition party than an imploding government. With many Socreds absolutely ruling out going to the NDP, and some NDP voters open to a liberal option (as they would never go Socred), the opportunity presented itself.

A core group of party supporters decided to give it one last push. If we couldn’t break through this time, there was no hope for the BC Liberal Party ever. We had no money and not much of an organization. But we did have a leader who was quick on his feet and would work day and night to succeed, and we started to draw some candidates that helped with credibility. My volunteer job was to find candidates with my pal Christy. There were good, young candidates in some places, like Speaker Linda Reid who was elected 25 years ago and ever since, and Gary Collins who won in Fort Langley. But we had many gaps, so when it came to candidate recruitment, I would find them, Christy would close them. During this time there was an epic road trip, borrowing Clive Tanner’s van, to Prince George, the Cariboo, Kamloops, and the Okanagan. Again, this is truly a story for another day.

We ended up with candidates in 71 of 75 ridings (I’m still mad about Prince George). That was enough to argue that Gordon Wilson should be on the debate. Of course, we were shut out of the debate because the NDP and Socreds didn’t want us there. So we launched a protest and had picketers in front of the CBC building. The pressure built and the network capitulated. We could not have asked for a better scenario – to have to fight to get on the debate and then to win the fight.

On debate night, party president Floyd Sully invited me to go to the CBC studios with him and be part of the team with Gordon Wilson. We showed up in his dressing room. I will never forget how calm he was. He was walking around, shirt off, listening but focused – his mind was elsewhere. Very calm. He had experience as an actor, which likely helped his preparation. I’m sure we were chattering away with miscellaneous advice that was completely off point and I’m sure he disregarded it. His media aide, John Stewart, prepared for the onslaught as there was a much bigger media hoard back then. Though the media didn’t know then that Gordon Wilson would be the story of the night and the election.

We watched the debate in the dressing room while it took place down the hall with no audience. When Premier Rita Johnston and Mike Harcourt were squabbling back and forth, Wilson nailed them: “This is a classic example of why nothing ever gets done in the Province of British Columbia”. Boom! I don’t think the media realized the impact of that line but they did realize that Wilson had made an impact. We were giddy in the dressing room. Floyd and I sprinted down the hall to the studio. I remember passing Mike Harcourt in the hall, “Hey, how are you” I think he said. Disciplined, cheerful, seemingly unruffled. Rita Johnston didn’t look too happy. Wilson was surrounded in the studio. He would never turn down a media interview after begging for attention for years. We were excited.

I had had this feeling once before when I helped the Manitoba Liberals in the 1988 election – the feeling of everything coming up roses. Sharon Carstairs had risen from one seat to almost win the election, settling for 20 and preventing Gary Filmon from forming a majority. Could this be the same? It was definitely on my mind that we could get on a roll, big time. There wasn’t a lot of time left in the election either.

Floyd and I thought we should head back to Party headquarters at 210 West Broadway. The office was closed so we walked in and our six-line switchboard was lighting up like a Christmas tree. We took calls, offers of help, crazies, you name it. We had finally been noticed.

An interesting thing about the 1991 campaign was that BCTV commissioned and ran nightly polls. While it continues to lead the ratings now as Global, back then it really dominated. Tony Parsons would come on at 6pm and they would announce the new numbers in their daily poll. The poll was probably a methodological disaster, but once the debate happened our numbers spiked. It became a self-fulfilling prophecy. Each good poll begat higher polling numbers the next time. As we rose, the Socreds became doomed. The Socred coalition was built on winnability. It became clear within days that the Liberals would be the party that would challenge the NDP.

As we headed into Thanksgiving weekend, there was a real likelihood we could win. The momentum seemed unstoppable. I remember talking on the phone with Clive Tanner, who was running in Saanich North & the Island and would win decisively. We speculated about forming government. At that point, Clive, who was in the bathtub, contemplated electrocuting himself.

The NDP appeared to get a grip and turned their guns on us. Glen Clark showed his fangs and attacked our platform. A hastily organized press conference where Gordon Wilson and Floyd Sully (who had run and served as Finance critic) costed our platform was necessary. Vaughn Palmer provided a dose of the first scrutiny our campaign had had. Up until the final week, no one thought we had a chance so no one cared if our plan made sense or who our candidates were. I think I can safely say that many of our candidates would not have survived a modern-day social media screening process.

Around that time, I was driving up Kingsway in Vancouver and came across Glen Clark’s campaign office. I walked in to collect some brochures. I was greeted by a receptionist (best practices) and was quickly identified as “undecided”. I was directed to a table of brochures and within 20 seconds I had Glen Clark interrogating me. “Hey, how are you? Undecided? Want a coffee?” Here he was in a safe seat and he was working for every vote. Of course, I folded like a cheap lawn chair from Zellers. I confessed my true identity and Glen switched gears to quiz me on Floyd Sully, who he debated on finance issues. “What’s he like? He seems intense.” Etc. In any event, that gives a glimpse how hungry the NDP were.

We had come from zero to somewhere. By the time Election Day arrived, I don’t think we thought we were going to win. But I did think something would happen, but how much, I didn’t know. I would have been happy with four seats. That was always our dream, to just get a toehold. It’s quite something to look at history and conventional wisdom then use your eyes and ears to understand what’s happening right in front of you.

In the final week of the campaign, Christy and I transitioned over to the Sunshine Coast to help the leader with his local campaign. He had to win and we were there to help. On October 17th at 8pm, we watched the first tranche of early results in Sechelt where it looked like we would be Opposition and would eclipse the Socreds. Gordon Wilson was up in Powell River. By the time the votes were all tallied up, we won 17 seats and 33% of the vote. We won historically liberal seats on the North Shore and west side of Vancouver, but we also took Saanich North, Richmond, South Delta, South Surrey, most of the Fraser Valley, and Kelowna. Places where Liberals had no business winning, usually.

It was clear that it would be quite a party that night. While Wilson flew down to Vancouver to address supporters, a crew of us from the Sunshine Coast were taken on a chartered boat over to Horseshoe Bay. It was a calm, warm night, cruising on moonlit waters before everything would change.

Volunteers from West Van picked us up in station wagons and drove us to the Villa Hotel in Burnaby. It was electric. My best friend Iain, who is a big guy, was drafted to bring Wilson into the room with another big guy, Jim. Peter Gzowski would comment on the “two gorillas” that brought the skinny, bookish professor, Gordon Wilson, into the frenzy.

There was a grumpy old guy named Dick Kirby who was from Oak Bay. He was the most hard-working, dedicated volunteer you would ever find. I will never forget walking into that ballroom and seeing Dick and everything we had worked for was in his eyes. When you are part of an underdog team that overcomes the odds like that, it is a really special bond. But when you add in the unselfishness of a guy like Dick Kirby, it is a joyful moment.   I will never forget that.

That’s where the story should end. It’s a good story.

Euphoria doesn’t last. Hard political choices are ultimately made. Organizations that can skate by for 28 days cannot sustain years of grinding unless they change. The BC Liberals had to decide what it wanted to be if it wanted to govern. It would go through a tough process between 1991 and 1993, when it elected Gordon Campbell to succeed Gordon Wilson. It would go through another tough process between 1993 and 1996 when it failed to win. It would go through a brutal five-year process from 1996 to 2001 when the NDP tanked, but waited until the fifth year of the mandate to go to the polls. It was a long decade. During that time, a modern political party was built one meeting at a time, one chicken-dinner fundraiser at a time, one local parade at a time, one vote at a time. The old saying comes to mind – the worst day in government is better than the best day in opposition. The hard work paid off with the greatest election win in BC history when the BC Liberals won 77 of 79 seats in the 2001 election.

Since 1991 the Party has changed and evolved. It has become a successful, modern political party that has taken a big-tent approach. Gordon Wilson created the opportunity. Gordon Campbell built the foundation, in painstaking fashion, and cemented it as the free enterprise coalition through eight grinding years in Opposition and three successive winning elections. Christy Clark renewed it and earned her own term, tapping into the 1991 experience, knowing that conventional wisdom can be defied, that the ultimate connection for leaders is with the voters, not the intermediaries, and that believing in oneself and the team around you is essential.

All three BC Liberal leaders – Wilson, Campbell, Clark – also teach us that it’s bloody hard work to create, build, and renew. I’m honoured to have served all three. And I’m honoured to have worked alongside those beyond the headlines that made it possible. It’s been quite a journey.

Update:

This blog post was cited by Nicole Garton in her well-researched article “The Big BC Shift”  which walks through the evolution of BC politics.  A good read for those interested in BC politics, which I assume is you since you are reading this.

Footnote:

Former MLA Wilf Hurd, who was elected in 1991, recently put an anthology of recollections together that marked this historic election and how it happened – “On the Edge of the Ledge – Rise of the BC Liberal Party 1986-1991”. Vaughn Palmer reviewed it here.

The worst performances of presidential candidates

Since WWII, which US presidential candidates have had the worst results?

goldwater1964poster.jpg

For months, I have sounded the alarm that Trump had a chance to win.  He defied the pundits by storming the GOP nomination and tapping into a rich vein of populist resentment.  He had a bump in the polls following the RNC convention.  He had a terrible August but rebounded following Hillary Clinton’s fainting episode in September.  He stayed surprisingly competitive in Ohio and Florida.  He now seems to have come crashing down. Though I think some wooden stakes should be kept on hand in the event they need to be driven through his political heart.

As Chart 1 shows, there has been a lot of volatility between the Democrats and GOP over time.  However, in the past five elections, the Democrats’s worst showing was 48.3% in 2004.  During that time, the GOP has only been above 48.3% once – in 2004 with George W.

Chart 1: Presidential popular vote (1948-2012)

Screen Shot 2016-10-13 at 9.37.40 AM.png

The worst presidential candidate results, by popular vote, since WWII have been:

  • 1992 – George HW Bush (37.4%) – vote was split by Ross Perot (18.9%)
  • 1972 – George McGovern (37.5%)
  • 1964 – Barry Goldwater (38.5%)

In fact, they are the only major presidential candidates to have sunk below 40% during that time.

The top showings since WWII are:

  • 1964 – LBJ (61.1%)
  • 1972 – Richard Nixon (60.7%)
  • 1984 – Ronald Reagan (58.8%)

The worst presidential candidate performances, by electoral college votes, have been:

  • 1984 – Walter Mondale (13)
  • 1972 – George McGovern (17)
  • 1980 – Jimmy Carter (49)
  • 1964 – Barry Goldwater (52)

It’s unlikely that Hillary Clinton will be anywhere near the top results but holding the trend line of the last five Democratic showings will secure victory.

Will Trump continue to slide?  Right now, he is tempting history.  He appears well above historic lows in electoral college votes, in part due to GOP strength in the South and rural states, but his ranking on popular vote could become Goldwater-esque.


Today’s presidential map is not JFK’s

I recently had the opportunity to visit the John F. Kennedy Presidential Library in Boston.  A must-see for any political junkie.  Amidst the exhibits on the 1960 presidential campaign, there was an electoral map of the results.  The differences were striking.  Many states that were red in 1960 are blue today; and vice versa.  As the presidential candidates debate tonight, they will be facing a very different political map than the one that occupied the minds of JFK and Richard Nixon 56 years ago.

  • California was Nixon’s in 1960.  Unfathomable as Republican today.
  • Texas was with JFK and LBJ all the way.  Strongly Republican now for many years.
  • The Deep South was won by the ‘Dixiecrats’, but the fault lines had emerged.
Screen Shot 2016-09-23 at 9.27.18 PM.png

JFK’s political math followed much different geography than Hillary Clinton’s

I count 23 states that switched colours between that election in 1960 and the most recent election in 2012, which encompassed a majority of the electoral college votes.

The Democrats in 1960 were shaking off segregationist voters, or rather, the segregationists were shaking off them.  George Wallace would emerge in the 1960s as a regional force, breaking the bonds of Southerners to the Democratic Party (and many would become Reagan Democrats in the 1980s).

The Republicans of 1960 had moderating influences.  They wore the mantle of Lincoln while having a sizeable following of Rockefeller Republicans, expressing an east coast, urban sensibility.  Nixon, himself, had a decent civil rights record.  They carried states like Vermont long before Bernie Sanders showed up.

Coalitions change over time.  One might think the party of Kennedy and the party of Obama would follow similar patterns, but they found very different routes to power.  No different in Canada where national parties have re-invented themselves as they have won and lost in regions over the years.  Justin Trudeau forged a new regional coalition in 2015 that had been unattainable for Liberals for many decades.  Brian Mulroney had built a “Quebec-Alberta” bridge in 1984 and 1988 that had seemed so tantalizingly close for Thomas Mulcair and the NDP.

In 2016, Donald Trump’s appeal to working-class white voters has threatened to destabilize Democratic states like Michigan and Pennsylvania, and make the difference in Ohio and Florida, while some have speculated that Hillary Clinton could reclaim  a southern state or two.  A key difference between 1960 and 2016 is that JFK and Nixon had a very wide battleground.  The two largest states – California and Texas – went down to the wire.  Famously, Illinois went Democrat by 9,000 votes, whether those votes were real, or imagined by the Cook County Daley machine.  The political map in the US is more polarized now.

Figure 1: 1960 Electoral Map

1960_electoral_map

The 1960 campaign was virtually tied – JFK with 49.72% and Nixon with 49.55% – and there was no room for third party candidates.  The electoral college was not as close: 303 for JFK and 219 for Nixon. (The other 16 electoral college votes were unpledged delegates in Mississippi and Alabama who ultimately voted for segregationist Senator Harry Byrd as president, even though he did not seek election).

The Republicans were strong in the west and midwest, extending through the middle of the country to Virginia, but for Illinois and Missouri.  They added three New England states and Florida.  The Democrats mainly had Texas and the South, Missouri, Great Lake states of Minnesota, Illinois, and Michigan, and populous east coast states like Massachusetts, New York, New Jersey, and Pennsylvania.

Figure 2: 2012 Electoral Map

Screen Shot 2016-09-23 at 6.27.12 PM.png

By 2012, the map had changed.  A majority of electoral college votes (302) changed hands between those two elections.  With California and Texas switching sides, that’s a change of 93 votes (2012) right there.

In the South in 2012, from Texas to South Carolina, the Republicans picked up 118 electoral college votes whereas they had none in 1960.  But they lost 74 votes on the western seaboard, and 47 between Ohio and Florida for a net loss of 121.

Table 1: State-by-State results, winning presidential campaigns in 1960 and 2012 (switching states in yellow)

Screen Shot 2016-09-23 at 9.14.32 PM.png

Real Clear Politics calculated that the average of current polling estimates (as of September 26th) has the 2016 electoral college at 272 Clinton, 266 Trump.  Rival strategists will be poring over the map to identify how they can remake it, as history shows it won’t necessarily stay the same.


Yes, Trump can still win

One month ago, I put out the question in this blog: “Can Trump still win?”  My answer was ‘yes’, and after a post-RNC/DNC convention nadir for Trump where I questioned my hypothesis (and my sanity), Trump has clawed his way back to contention.  The race appears tighter than it ought to be, yet it is.

Here’s the Real Clear Politics tracking of polls (aggregated):

Screen Shot 2016-09-06 at 3.06.47 PM.png

You can see that Trump spiked up during the RNC convention then sank immediately after.  In the past few weeks, he has been climbing.

I’ve been watching the USC-LA Times poll, which tracks every night.  It’s been among the most generous of polls to Trump.  Even if there is a skew in the methodology, it shows the same picture – that the race has been volatile.

Screen Shot 2016-09-06 at 3.07.20 PM.png

The polling junkies can check into Nate Silver’s site and see that he has Trump at a 31% chance to win.  One out of three chance?  Yikes.

Simple Math to get to 270 electoral college votes:

  • Hold Romney states (206)
  • Win Florida (29) and Ohio (18), then Michigan (16) to tie, or Pennsylvania (20) to win
  • Presto! President Trump

Easier said than done, but with two months left in the campaign – a political lifetime – and the debates yet to unfold, one thing can be said for sure: Hillary Clinton has not been able to drive the final wooden stake through the heart of this political vampire.

Any polling can only be viewed as a glimpse in time, and not very trustworthy, but let’s continue to play along.  The latest Washington Post-Survey Monkey poll of over 74,000 Americans across 50 states shows Trump leading in Ohio, neck and neck in Florida and Michigan, and only four points back in Pennsylvania.  That’s the good news for Trump.  The bad news is that Clinton appears competitive in Texas – game over if that happens.  Also, Romney states such as North Carolina and Arizona look shaky for the Republicans.

2012 Electoral College:

Screen Shot 2016-09-06 at 3.15.00 PM.png

There are many other states that could go different ways than 2012.  Wisconsin and Iowa could go Republican this time.  Georgia could go Democrat.

But it could all go down to the Nebraska 2nd District.  Unlike every other state except Maine, Nebraska apportions its electoral college by congressional district.  The 2nd District in Omaha is the one area of Nebraska that could vote Democrat.  So, if Trump holds Romney states, and wins Ohio, Florida, and Michigan, it might just be a committed group of Cornhuskers that makes it a 270-268 win for Clinton. So, if Hillary can’t drive the wooden stake through the heart of the Donald herself, maybe Warren Buffet can do it for her.  Please.


Can Trump still win?

It’s hard to imagine a worse stretch for Donald Trump than what has transpired since the DNC Convention.  In my most recent blog post, I raised the spectre of a Trump presidency based on a 7-point lead in the USC-LA Times rolling-track poll.  I went on CKNW 98 with Michael Smyth and talked about the importance of not underestimating Trump’s chances.  The threat might almost seem to many like a moot point now.  That’s a dangerous assumption.  I still believe that Trump can win – it’s not likely that he will win, but he could win.  Despite his egregious campaigning, his poll numbers could be a lot worse.

Screen Shot 2016-08-06 at 1.52.24 PM.png

The USC-LA Times poll has a big sample (over 2000) and runs on a rolling track so that there’s fresh interviews every night, with the most recent night replacing the results from 7 days previous.  Compared to other polls, this polls has been among the most friendly to Trump (other polls have Clinton up, on average, 7 points).  Right now, USC-LA Times has the race tied whereas Trump had opened a seven point lead following the RNC Convention.

Perhaps the USC-LA Times has a built -in skew, which can happen in online panels, but what it does tell us is the trend and who has moved the hardest toward Clinton.  In that respect, the answer is resoundingly women.

Chart 1: Female voters

Since July 26, Clinton has broadened her lead among women from one point to thirteen (50-37).

Screen Shot 2016-08-06 at 12.31.18 PM.png

Chart 2: Male voters

Despite Trump’s self-inflicted bad press, his support is remarkably resilient among men.  In fact, he hasn’t lost any support since July 26, holding at 52%.  Clinton has moved up from 37% to 39%.

Screen Shot 2016-08-06 at 12.33.30 PM.png

Trump’s support among white voters is also largely unchanged.  He’s down about one point since July 26 while Clinton is up 2.  Trump couldn’t do any worse with African-Americans so he’s constant there, getting absolutely blown out.  Hispanics and “Other ethnicity” (not White, African-American, or Hispanic) have shown movement away from him.

Chart 3:  Hispanic voters

Clinton has broadened her lead from 52%-36% to 59%-31%.  That’s a twelve point gain.

Screen Shot 2016-08-06 at 12.40.15 PM.png

Chart 4: Other Ethnicity

Trump had a sizeable lead on July 26 among this group but Clinton has now closed the gap, moving the numbers from 59% – 33% to a dead heat at 46% each.  One can easily speculate that the controversy with the family of the Muslim-American war hero precipitated this change.

Screen Shot 2016-08-06 at 12.42.58 PM.png

So how could Trump still win?

Narrow geographic pathway.  Trump must hold all of Romney’s states (a tall order) and win Florida, Ohio, and either Pennsylvania or Michigan.  He has been neck and neck in Florida and Ohio, and further behind in the latter two.  He’s banking on his message of economic alienation working among traditional Democratic voters.  It was going to be a narrow pathway for any Republican – Rubio, Cruz, Bush, Kasich or anyone else.

Clinton’s unpopularity.  As poorly as Trump has seemed to perform in the past ten days, Americans are not crazy about Hillary Clinton either.  Certainly, she has had an upswing, particularly with women, but she remains a juicy target for the Republicans.

Time.  Trump has lots of it.  Three months is a political eternity.  If he continues to death spiral, some speculate he might not even make it to November.  I wouldn’t rule it out, but the more likely scenario is that he regroups.

Stabilize.  Just a little less craziness would be a big momentum builder for the campaign.  Expectations are now so low for the Trump campaign that a solid week of on-message performance may completely change the narrative.  There are so many media cycles between now and November, and so much thirst by the cable news networks for content, that you could get the media to run with almost anything.

Clinton is in a much stronger position in terms of discipline, money, infrastructure, and the breadth of her coalition.  Yet Trump remains in striking distance.

So can Trump still win?  Yes.  We can look to countless examples of conventional wisdom being upended whether it was Justin Trudeau’s shocking majority government win only 60 days after he was in third place, the Brexit results, or the rise of Trump himself. He still has strong support among white voters and men.  The Democrats cannot afford to take their foot off the Trump campaign’s throat until it’s over.  Polls schmolls – you never know until the votes are cast.


Trumping Clinton: 7 days of momentum

USC is running a rolling track poll where they interview 300-400 people a day (online) right through to Election Day.  This is a serious poll with serious methodology.  The numbers shown daily represent seven days of tracking. Each day, the daily results from 7 days ago drop off and the current day is added, making it a rolling track.  This smooths results and shows more of a trendline rather than sudden shifts.  So, if there is a big move, it might not become fully apparent for several days.

For the past 7 days, Donald Trump’s support has increased to, now, a 7 point lead.  This includes several days now of the Democratic National Convention.  Trump certainly had an RNC  Convention bounce but yet to see a Dem bounce.

Chart 1: Election forecast (n=2150)

Screen Shot 2016-07-28 at 10.58.20 AM.png

Some Democratic pundits have cautioned against “bedwetting”.  Yes, it’s July.  There’s a long way to go.

The issue the Democrats have to confront, however, is that Trump can win.  There has been a lot of commentary about how it’s impossible for Trump to win because of lack of support among Hispanics, Blacks, women, etc.  However, he is crushing it with whites and males.


Here is a breakdown of the numbers to show how Trump is rising:

Chart 2: Predicted Winner

While Hillary Clinton is still seen as the likely winner by 49% to 45%, that gap has narrowed from 13 points to 4 points in the past 17 days.  More Americans are believing in the possibility of a Trump presidency – will that help or hurt Trump?

Screen Shot 2016-07-28 at 9.31.21 AM.png

Chart 3: Intention to Vote

Trump and Clinton supporters are virtually tied when it comes to whether they intend to vote.  They have leapfrogged on this.  Trump’s turnout numbers are likely helped because he has strong support among older voters; Clinton’s turnout numbers are likely helped because Trump is highly polarizing and antagonizing.

Screen Shot 2016-07-28 at 9.33.17 AM.png

Chart 4: Seniors 

Trump has a big lead (55% to 38%), and seniors typically vote at a higher rate.  Trump leads 18-34s too, right now.

Screen Shot 2016-07-28 at 9.36.31 AM.png

Chart 5: Whites

Trump leads white Americans 57% to 31%.  African-American voters are 81% to 4% for Clinton.  Hispanics, though, are reported at 50% to 37% for Clinton.  This is where one might wonder if the poll has a large enough, or representative, sample of Hispanic voters.  Or maybe that’s reality – are gender and age are ‘trumping’ race among Hispanics?

Screen Shot 2016-07-28 at 9.38.08 AM.png

Chart 6: Men

Trump leads Clinton by 17 points among men (53% – 36%) while Clinton has a two-point lead among women.

Screen Shot 2016-07-28 at 10.47.19 AM.png

What does it all mean?

Trump can win.  If you can rack up a 7 point lead, you can obviously win.  Even if this poll is inaccurate, other polls are showing Trump is leading.  Even though Hillary has a small lead in Ohio, Trump has a small lead in Florida.

The challenge for Democrats is to approach the race for what it is – a very unconventional campaign.  Trump is attracting voters who are very anti-establishment including alienated Democrats.  How many more examples do we need to see – Rob Ford, Brexit, Jeremy Corbyn, Bernie Sanders, and Trump himself – to understand that there is a very large constituency for those who tap into the vein of frustration, resentment, and anxiety?

This rise in Trump support may be short-term.  It may be illusory.  It may be overstated.  But it proves that Clinton is no shoo-in.   The presidential campaign has been very unkind to her personal popularity and favourables.  Bernie Sanders did a lot to soften her support and drive votes away.  She has gone from a plus 10% to minus 17% in two years.  At her peak back in 2008, she had 69% favourable rating.

Chart 7: Hillary Clinton’s favourables over past two years.

Screen Shot 2016-07-28 at 10.54.39 AM.png


So, the first thing Democrats have to face is that they have a problem.  Now, deal with it.  If the DNC Convention does not move the dial, then it’s time for Plan B, whatever that is.


Brexit: Polls are split, but Market has decided

Updated (3 hours before polls close, June 23)

Interesting piece in The Telegraph that shows slight lead for Remain.

There will not be an election-style exit poll, but YouGov plans to release an election day poll at the moment the polls close (2pm PT / 5pm ET).  If there is going to be a shocking outcome, the first glimpse may be right then.

Gamblers are 84% certain of a Remain victory.  Do they know something we don’t know?  They are probably reading the polls as their main source of information.  If the polls are wrong, they’re wrong. UBC’s Sauder School Election Prediction market is made up of bettors betting real money to predict election outcomes.  In 2013, 85% predicted an NDP majority government; in 2015, only 20% predicted a Trudeau majority.  So, a sucker is born every minute.  We’ll see if the Brits are better bettors.

Professor John Curtice reiterates today that the polls can’t be trusted and it’s basically a crapshoot.  The public pollsters notoriously got it wrong in May 2015 and it was Curtice who conducted the election day exit poll that predicted the majority no one expected.  We might just have to wait until the votes are counted!

———-

John Curtice (@whatUKthinks), the polling expert who shocked the UK when he predicted a Conservative majority one minute after the polls closed in the 2015 General Election, says Brexit is too close to call.

The markets and the bettors are predicting a victory for Remain.  Political betting analyst Mike Smithson (@MSmithsonPB) has provided data that shows gamblers moved toward Leave about a week ago, but there was a sharp upturn for Remain after the Jo Cox murder.

Figure 1: Remain is a better bet for 75% of UK bettors.

Screen Shot 2016-06-22 at 8.58.00 AM.png

What are the markets doing?  British Sterling surged over the past few days, pricing in a Remain outcome.

Figure 2:  GBP climbs in final week

Screen Shot 2016-06-22 at 9.23.28 AM.png

And finally, what are the polls saying?

Figure 3: Compilation of Brexit polls (@MSmithsonPB)

Screen Shot 2016-06-22 at 8.58.29 AM.png

There has been a slight advantage for Remain via Telephone surveys and a slight advantage for Leave via Online surveys. While the markets and the bettors have turned toward the Remain camp as the likely outcome, those responding to polls are still very divided.

YouGov’s detailed tables reveal some of the underlying divisions in British society concerning Brexit.

The numbers shown in Figure 3 above are Decided support, however, as YouGov reminds us, there are still undecided voters (9%) and those who say they won’t vote (4%).  On decided vote, YouGov has it at 44 Remain, 43 Leave.

According to YouGov, here are some of the dividing lines:

Remain voters

  • Labour (64%) and LibDem (59%) voters
  • 18-24s (64%) and 25-49s (45%)
  • London (50%) and Scotland (56%)
  • Upper/Middle class – ABC1 voters (53%)

Leave voters

  • Conservative (55%) and UKIP (95%) voters
  • 50-64s (49%) and 65+ (58%)
  • Rest of South (45%); Midland-Wales (51%); North (47%)
  • Skilled working class/ working class/non-working -C2DE voters (52%)

When asked who is most certain to vote, Remain was at 79% and Leave at 84%.

On the dividing lines, there is a fundamental generational difference.  The range between young and old is stark.  The Euro debate, and underlying views on immigration, shape partisan leanings as evidenced in the Party ID splits. Class is also significant.  Then in Scotland, attitudes are tied somewhat to Scottish identity – leave Britain, but stay in EU.

But who will vote?

One would expect a high turnout.  YouGov indicates a tilt toward Leave voters.  Young people are expressing a strong preference for Remain but election turnout studies consistently show they vote at a lower rate.  Will they close the gap, like they did in Canada’s federal election, in the Brexit vote?  Will lower income voters vote at the same rate as higher income voters?  How will the UK’s sizeable immigrant communities vote and will they turnout to vote?  We don’t know this from the YouGov poll, possibly because it’s online which is typically less representative of people who don’t speak or read English well.  Telephone surveys are better in including those populations which may explain a slight leaning to Remain.

Going back to John Curtice, he is the most credible voice in the UK on polling and he believes it’s too close to call.   Curtice says the result could split the difference between the aggregate of phone polls which have Remain at 51% and the aggregate of online polls that have Leave at 51%.  A cliffhanger like the Quebec referendum of 1995.

This process ends in a vote and an outcome, but this discussion of the cold, hard numbers comes just days after a shocking murder of Labour MP Jo Cox.  This is no ordinary vote.  The referendum campaign has exposed the fault lines of UK society.  The stakes are extraordinarily high, especially in the context of a campaign that appears to be a photo-finish.

I’ll bet on Remain, based on voters pulling back due to perceived risk, like they did in Quebec in 1995 and in the recent Scottish referendum.  We’ll see if the gamblers and traders got it right.


Brexit the latest chapter in year of protest

“No10 panics as Leave surges”, shouts today’s Daily Telegraph.  “Massive swing to Brexit“, screams another.

With only 11 days until the Brexit campaign reaches its conclusion, momentum appears to be swinging at a very inopportune time for the Remain campaign.  A new poll shows a 55-45 gap in favour of Leave (adjusted for voter turnout, it’s 53-47).  UK voters appear open to following a narrative that has developed over the past year on both sides of the Atlantic – defying the establishment.

Brexit

The papers and TV news are filled with Remain campaigners issuing dire warnings about the implications of leaving the EU.  Former prime ministers Tony Blair and John Major said peace in Northern Ireland was at stake.  BBC News discussed an open letter expressing concern for science funding.  Prime Minister David Cameron is visiting job sites to underscore the threat to employment.  Former Labour leader Ed Miliband exhorted Labour supporters to get behind Remain.

It’s a robust campaign.  The Remain campaign is backed by the leadership of the four major political parties – governing Conservatives, Labour, the Scottish Nationalists, and the Lib Dems.

Significant voices in the Conservatives and Labour are advocating for Leave, including former Mayor of London Boris Johnson, cabinet ministers, and Labour MPs, not to mention UKIP, which garnered 13% of the popular vote in last year’s general election and wholeheartedly embraces a Brexit.   Other than UKIP, the Leave campaigners are bucking against their own parties, and while there is an aroma of opportunism, there are also points given for authenticity.

There are some interesting divides at play. There is an elite/populism divide.  The insiders favour Remain while the outsiders look to Leave.  The pro Euro faction of Labour obviously favours Remain but a significant bloc of Labour voters are going the other way.  Labour was particularly vulnerable to UKIP in last year’s election as working-class white voters outside London looked for a new vehicle for protest.  There is a generational divide.  Polls claim that young people are strongly in favour of Remain while plus 55 year old voters favour Leave.

Some constituencies are not bearing as much fruit for Remain as previously thought. Columnist Stephen Bush writes that hoped-for support from liberals and multicultural communities for Remain is less than certain:

The [Labour] Party always knew that it had a problem with persuading white voters in its small-town heartlands to back staying in the European Union.  It now appears that they have a problem persuading middle-class liberals in big cities to turn out to vote, and that the party’s large ethnic minority vote is more hostile to the European project than either the Labour leadership or the Remain campaign ever expected.

We’ve seen this movie before in Canada when a cross-partisan alliance (of elites) fails to mobilize their parties’ followers.  The national referendum on the Charlottetown Accord in 1992 is a shining example where dire warning were made about the future of Canada if there was a No vote.  The outcome was actually “Hell, No”.  Canada survived.

Last year’s transit referendum in Metro Vancouver was another similar example.  Everyone supported Yes except the people.

The 1995 Quebec referendum and 2014 Scottish referendum offer more insights.  Dire warnings were made, and heeded, by voters.  There were moments in those campaigns where the Yes campaigns looked like they would succeed.  In Quebec, the ultimate margin was razor thin.  A key difference was that these campaigns advocated for independence.  The EU referendum is the reverse – “yes” means status quo.  Voting “no” means change.  To mobilize grumpy protest voters, it is arguably easier to coax a “no” than a “yes”.

In all cases, emotion is key.  Bombarding voters with facts and figures from self-interested elites is not the path to success when contrasted with fears over migrants or anger over EU spending.

In the Quebec example, while there were many factors at play, a late-campaign emotional outpouring from Canadians provided much needed momentum.  The federalist forces had their backs against the wall and they rallied, literally, in an historic and emotional show of force.

Can the Remain campaign muster a cogent emotional argument in the next 11 days?  In the past year, the success of Donald Trump, Jeremy Corbyn, and Bernie Sanders provides striking examples of the resolve of voters outside the establishment to go their own way and absolutely tune out traditional voices.  Remain will need to change up their playbook to reach voters that are turned off as much by the messengers as they are by the message.

Over pints at a pub here in the UK, I talked with a collection of university students.  They are incredulous that the UK could vote to Leave.  Their modern outlook sees the opportunities that the EU brings.  The Remain campaign will need to draw on generational differences and mobilize this group of voters that has been typically less likely to vote.

Will the UK vote to Brexit? Most here think not but the next week will be critical in swinging the momentum either way.  As has been said many times, campaigns matter.


Manitoba Election cheat sheet

“Glorious and Free” is the Manitoba motto.  Free of the NDP by midnight Tuesday, I’ll bet, though not very gloriously.

Despite some late controversy over the Manitoba PC leader’s sojourns to Costa Rica, available evidence seems to indicate it’s the NDP that will be heading to sunnier climes come Tuesday night.  The recent TV debate did nothing to motivate NDP and Liberal voters and, if anything, opened up the Greens as a protest vehicle for centre-left voters.  For British Columbians, some parallels to 2001.  Voters seem focused on getting the job done despite reservations with the leading party.   See my earlier analysis here.

Screen Shot 2016-04-18 at 10.32.51 PM

They have unicorns in Manitoba – maybe the NDP have a chance?


In 2011, Greg Selinger’s Manitoba NDP won 45.9% of the popular vote and elected 37 MLAs.

Hugh McFadyen’s PCs won 43.5% of the popular vote and elected 19 MLAs.

The Liberals held the seat of their then-Leader Jon Gerrard and received 7.5% of the popular vote.

While the PCs won rural (non-Northern) Manitoba by 22 points, they couldn’t crack Winnipeg. The NDP harvested 51% of the votes in Winnipeg, powering their majority and added to their seat count with their base of support in Northern Manitoba where they took 61.4% of the vote across five seats.

Table 1: Popular vote by region, 2011 MB election

LIB NDP PC
North 5 seats 4.71% 61.38% 32.44%
Rest of MB 21 seats 4.43% 35.69% 57.84%
Winnipeg 31 seats 9.60% 50.88% 35.67%

The following table ranks the ridings in order of percentage of NDP vote from the 2011 election.  The NDP scored 73.2% in The Pas.  They won 8 seats by over 60% and a further 25 seats by over 50%.  The remaining four seats were in the 45-49% range.   In many jurisdictions like BC, Alberta, and federally, you will see instances of elected members with 30% or less.  Manitoba has been very polarized.

The PCs look poised to win a bushel of seats from the NDP in that group from 45% to 60% (NDP vote in last election). The NDP seats in the plus 60% range may hold.

High profile NDP candidate Wab Kinew, embattled by campaign controversy, is running in Fort Rouge against the Liberal leader Rana Bokhari.  This would be a seat that the NDP ought to lose given the trend in the numbers.  The Liberal leader is out of the picture, it seems. So the PCs could emerge as the winner here.

The Green Leader James Beddome is seeking a seat in Fort Garry-Riverview. A bit of a stretch to see a Green win, but not a surprise to see a decent second.

In the table below, NDP supporters will not want to see any PC wins until much further down the list.  A PC win in a riding that was plus 60% for the NDP last election would be a very bad sign.

Table 2: Seats in order of NDP % of the vote in the 2011 election

Electoral Division Member Elected Party NDP%
The Pas WHITEHEAD, Frank NDP 73.21%
Point Douglas CHIEF, Kevin NDP 72.88%
St. Boniface SELINGER, Greg NDP 68.57%
Thompson ASHTON, Steve NDP 68.20%
Minto SWAN, Andrew NDP 66.00%
St. Johns MACKINTOSH, Gord NDP 65.55%
Concordia WIEBE, Matt NDP 62.72%
Wolseley ALTEMEYER, Rob NDP 60.25%
St. Vital ALLAN, Nancy NDP 59.80%
Kildonan CHOMIAK, Dave NDP 59.20%
Burrows WIGHT, Melanie NDP 59.01%
Logan MARCELINO, Flor NDP 58.09%
Assiniboia RONDEAU, Jim NDP 58.00%
Transcona REID, Daryl NDP 57.92%
Flin Flon PETTERSEN, Clarence NDP 56.84%
Kewatinook ROBINSON, Eric NDP 56.80%
Rossmere BRAUN, Erna NDP 56.38%
Swan River KOSTYSHYN, Ron NDP 55.82%
Selkirk DEWAR, Greg NDP 55.59%
Fort Garry-Riverview ALLUM, James NDP 55.29%
Radisson JHA, Bidhu NDP 54.95%
Dauphin STRUTHERS, Stan NDP 54.78%
Riel MELNICK, Christine NDP 54.69%
Brandon East CALDWELL, Drew NDP 54.68%
Elmwood MALOWAY, Jim NDP 54.15%
Fort Richmond IRVIN-ROSS, Kerri NDP 53.16%
Seine River OSWALD, Theresa NDP 52.88%
Dawson Trail LEMIEUX, Ron NDP 52.24%
Southdale SELBY, Erin NDP 51.84%
The Maples SARAN, Mohinder NDP 51.49%
Gimli BJORNSON, Peter NDP 51.43%
Fort Rouge HOWARD, Jennifer NDP 50.95%
Interlake NEVAKSHONOFF, Tom NDP 50.24%
St. James CROTHERS, Deanne NDP 49.61%
Brandon West HELWER, Reg PC 46.72%
Kirkfield Park BLADY, Sharon NDP 46.61%
Tyndall Park MARCELINO, Ted NDP 45.00%
St. Norbert GAUDREAU, Dave NDP 44.94%
River East MITCHELSON, Bonnie PC 43.92%
Portage la Prairie WISHART, Ian PC 39.14%
Lac du Bonnet EWASKO, Wayne PC 38.42%
St. Paul SCHULER, Ron PC 37.26%
Riding Mountain ROWAT, Leanne PC 34.41%
Arthur-Virden MAGUIRE, Larry PC 30.09%
Charleswood DRIEDGER, Myrna PC 29.88%
Fort Whyte McFADYEN, Hugh PC 29.49%
Spruce Woods CULLEN, Cliff PC 28.47%
La Verendrye SMOOK, Dennis PC 26.02%
Lakeside EICHLER, Ralph PC 25.84%
Tuxedo STEFANSON, Heather PC 25.30%
Midland PEDERSEN, Blaine PC 23.56%
Emerson GRAYDON, Cliff PC 19.60%
Morris TAILLIEU, Mavis PC 19.26%
River Heights GERRARD, Jon Liberal 17.74%
Agassiz BRIESE, Stu PC 17.12%
Morden-Winkler FRIESEN, Cameron PC 11.38%
Steinbach GOERTZEN, Kelvin PC 7.60%
 NDP in MB 45.94%