The worst performances of presidential candidates

Since WWII, which US presidential candidates have had the worst results?

goldwater1964poster.jpg

For months, I have sounded the alarm that Trump had a chance to win.  He defied the pundits by storming the GOP nomination and tapping into a rich vein of populist resentment.  He had a bump in the polls following the RNC convention.  He had a terrible August but rebounded following Hillary Clinton’s fainting episode in September.  He stayed surprisingly competitive in Ohio and Florida.  He now seems to have come crashing down. Though I think some wooden stakes should be kept on hand in the event they need to be driven through his political heart.

As Chart 1 shows, there has been a lot of volatility between the Democrats and GOP over time.  However, in the past five elections, the Democrats’s worst showing was 48.3% in 2004.  During that time, the GOP has only been above 48.3% once – in 2004 with George W.

Chart 1: Presidential popular vote (1948-2012)

Screen Shot 2016-10-13 at 9.37.40 AM.png

The worst presidential candidate results, by popular vote, since WWII have been:

  • 1992 – George HW Bush (37.4%) – vote was split by Ross Perot (18.9%)
  • 1972 – George McGovern (37.5%)
  • 1964 – Barry Goldwater (38.5%)

In fact, they are the only major presidential candidates to have sunk below 40% during that time.

The top showings since WWII are:

  • 1964 – LBJ (61.1%)
  • 1972 – Richard Nixon (60.7%)
  • 1984 – Ronald Reagan (58.8%)

The worst presidential candidate performances, by electoral college votes, have been:

  • 1984 – Walter Mondale (13)
  • 1972 – George McGovern (17)
  • 1980 – Jimmy Carter (49)
  • 1964 – Barry Goldwater (52)

It’s unlikely that Hillary Clinton will be anywhere near the top results but holding the trend line of the last five Democratic showings will secure victory.

Will Trump continue to slide?  Right now, he is tempting history.  He appears well above historic lows in electoral college votes, in part due to GOP strength in the South and rural states, but his ranking on popular vote could become Goldwater-esque.


Today’s presidential map is not JFK’s

I recently had the opportunity to visit the John F. Kennedy Presidential Library in Boston.  A must-see for any political junkie.  Amidst the exhibits on the 1960 presidential campaign, there was an electoral map of the results.  The differences were striking.  Many states that were red in 1960 are blue today; and vice versa.  As the presidential candidates debate tonight, they will be facing a very different political map than the one that occupied the minds of JFK and Richard Nixon 56 years ago.

  • California was Nixon’s in 1960.  Unfathomable as Republican today.
  • Texas was with JFK and LBJ all the way.  Strongly Republican now for many years.
  • The Deep South was won by the ‘Dixiecrats’, but the fault lines had emerged.
Screen Shot 2016-09-23 at 9.27.18 PM.png

JFK’s political math followed much different geography than Hillary Clinton’s

I count 23 states that switched colours between that election in 1960 and the most recent election in 2012, which encompassed a majority of the electoral college votes.

The Democrats in 1960 were shaking off segregationist voters, or rather, the segregationists were shaking off them.  George Wallace would emerge in the 1960s as a regional force, breaking the bonds of Southerners to the Democratic Party (and many would become Reagan Democrats in the 1980s).

The Republicans of 1960 had moderating influences.  They wore the mantle of Lincoln while having a sizeable following of Rockefeller Republicans, expressing an east coast, urban sensibility.  Nixon, himself, had a decent civil rights record.  They carried states like Vermont long before Bernie Sanders showed up.

Coalitions change over time.  One might think the party of Kennedy and the party of Obama would follow similar patterns, but they found very different routes to power.  No different in Canada where national parties have re-invented themselves as they have won and lost in regions over the years.  Justin Trudeau forged a new regional coalition in 2015 that had been unattainable for Liberals for many decades.  Brian Mulroney had built a “Quebec-Alberta” bridge in 1984 and 1988 that had seemed so tantalizingly close for Thomas Mulcair and the NDP.

In 2016, Donald Trump’s appeal to working-class white voters has threatened to destabilize Democratic states like Michigan and Pennsylvania, and make the difference in Ohio and Florida, while some have speculated that Hillary Clinton could reclaim  a southern state or two.  A key difference between 1960 and 2016 is that JFK and Nixon had a very wide battleground.  The two largest states – California and Texas – went down to the wire.  Famously, Illinois went Democrat by 9,000 votes, whether those votes were real, or imagined by the Cook County Daley machine.  The political map in the US is more polarized now.

Figure 1: 1960 Electoral Map

1960_electoral_map

The 1960 campaign was virtually tied – JFK with 49.72% and Nixon with 49.55% – and there was no room for third party candidates.  The electoral college was not as close: 303 for JFK and 219 for Nixon. (The other 16 electoral college votes were unpledged delegates in Mississippi and Alabama who ultimately voted for segregationist Senator Harry Byrd as president, even though he did not seek election).

The Republicans were strong in the west and midwest, extending through the middle of the country to Virginia, but for Illinois and Missouri.  They added three New England states and Florida.  The Democrats mainly had Texas and the South, Missouri, Great Lake states of Minnesota, Illinois, and Michigan, and populous east coast states like Massachusetts, New York, New Jersey, and Pennsylvania.

Figure 2: 2012 Electoral Map

Screen Shot 2016-09-23 at 6.27.12 PM.png

By 2012, the map had changed.  A majority of electoral college votes (302) changed hands between those two elections.  With California and Texas switching sides, that’s a change of 93 votes (2012) right there.

In the South in 2012, from Texas to South Carolina, the Republicans picked up 118 electoral college votes whereas they had none in 1960.  But they lost 74 votes on the western seaboard, and 47 between Ohio and Florida for a net loss of 121.

Table 1: State-by-State results, winning presidential campaigns in 1960 and 2012 (switching states in yellow)

Screen Shot 2016-09-23 at 9.14.32 PM.png

Real Clear Politics calculated that the average of current polling estimates (as of September 26th) has the 2016 electoral college at 272 Clinton, 266 Trump.  Rival strategists will be poring over the map to identify how they can remake it, as history shows it won’t necessarily stay the same.


Yes, Trump can still win

One month ago, I put out the question in this blog: “Can Trump still win?”  My answer was ‘yes’, and after a post-RNC/DNC convention nadir for Trump where I questioned my hypothesis (and my sanity), Trump has clawed his way back to contention.  The race appears tighter than it ought to be, yet it is.

Here’s the Real Clear Politics tracking of polls (aggregated):

Screen Shot 2016-09-06 at 3.06.47 PM.png

You can see that Trump spiked up during the RNC convention then sank immediately after.  In the past few weeks, he has been climbing.

I’ve been watching the USC-LA Times poll, which tracks every night.  It’s been among the most generous of polls to Trump.  Even if there is a skew in the methodology, it shows the same picture – that the race has been volatile.

Screen Shot 2016-09-06 at 3.07.20 PM.png

The polling junkies can check into Nate Silver’s site and see that he has Trump at a 31% chance to win.  One out of three chance?  Yikes.

Simple Math to get to 270 electoral college votes:

  • Hold Romney states (206)
  • Win Florida (29) and Ohio (18), then Michigan (16) to tie, or Pennsylvania (20) to win
  • Presto! President Trump

Easier said than done, but with two months left in the campaign – a political lifetime – and the debates yet to unfold, one thing can be said for sure: Hillary Clinton has not been able to drive the final wooden stake through the heart of this political vampire.

Any polling can only be viewed as a glimpse in time, and not very trustworthy, but let’s continue to play along.  The latest Washington Post-Survey Monkey poll of over 74,000 Americans across 50 states shows Trump leading in Ohio, neck and neck in Florida and Michigan, and only four points back in Pennsylvania.  That’s the good news for Trump.  The bad news is that Clinton appears competitive in Texas – game over if that happens.  Also, Romney states such as North Carolina and Arizona look shaky for the Republicans.

2012 Electoral College:

Screen Shot 2016-09-06 at 3.15.00 PM.png

There are many other states that could go different ways than 2012.  Wisconsin and Iowa could go Republican this time.  Georgia could go Democrat.

But it could all go down to the Nebraska 2nd District.  Unlike every other state except Maine, Nebraska apportions its electoral college by congressional district.  The 2nd District in Omaha is the one area of Nebraska that could vote Democrat.  So, if Trump holds Romney states, and wins Ohio, Florida, and Michigan, it might just be a committed group of Cornhuskers that makes it a 270-268 win for Clinton. So, if Hillary can’t drive the wooden stake through the heart of the Donald herself, maybe Warren Buffet can do it for her.  Please.


Can Trump still win?

It’s hard to imagine a worse stretch for Donald Trump than what has transpired since the DNC Convention.  In my most recent blog post, I raised the spectre of a Trump presidency based on a 7-point lead in the USC-LA Times rolling-track poll.  I went on CKNW 98 with Michael Smyth and talked about the importance of not underestimating Trump’s chances.  The threat might almost seem to many like a moot point now.  That’s a dangerous assumption.  I still believe that Trump can win – it’s not likely that he will win, but he could win.  Despite his egregious campaigning, his poll numbers could be a lot worse.

Screen Shot 2016-08-06 at 1.52.24 PM.png

The USC-LA Times poll has a big sample (over 2000) and runs on a rolling track so that there’s fresh interviews every night, with the most recent night replacing the results from 7 days previous.  Compared to other polls, this polls has been among the most friendly to Trump (other polls have Clinton up, on average, 7 points).  Right now, USC-LA Times has the race tied whereas Trump had opened a seven point lead following the RNC Convention.

Perhaps the USC-LA Times has a built -in skew, which can happen in online panels, but what it does tell us is the trend and who has moved the hardest toward Clinton.  In that respect, the answer is resoundingly women.

Chart 1: Female voters

Since July 26, Clinton has broadened her lead among women from one point to thirteen (50-37).

Screen Shot 2016-08-06 at 12.31.18 PM.png

Chart 2: Male voters

Despite Trump’s self-inflicted bad press, his support is remarkably resilient among men.  In fact, he hasn’t lost any support since July 26, holding at 52%.  Clinton has moved up from 37% to 39%.

Screen Shot 2016-08-06 at 12.33.30 PM.png

Trump’s support among white voters is also largely unchanged.  He’s down about one point since July 26 while Clinton is up 2.  Trump couldn’t do any worse with African-Americans so he’s constant there, getting absolutely blown out.  Hispanics and “Other ethnicity” (not White, African-American, or Hispanic) have shown movement away from him.

Chart 3:  Hispanic voters

Clinton has broadened her lead from 52%-36% to 59%-31%.  That’s a twelve point gain.

Screen Shot 2016-08-06 at 12.40.15 PM.png

Chart 4: Other Ethnicity

Trump had a sizeable lead on July 26 among this group but Clinton has now closed the gap, moving the numbers from 59% – 33% to a dead heat at 46% each.  One can easily speculate that the controversy with the family of the Muslim-American war hero precipitated this change.

Screen Shot 2016-08-06 at 12.42.58 PM.png

So how could Trump still win?

Narrow geographic pathway.  Trump must hold all of Romney’s states (a tall order) and win Florida, Ohio, and either Pennsylvania or Michigan.  He has been neck and neck in Florida and Ohio, and further behind in the latter two.  He’s banking on his message of economic alienation working among traditional Democratic voters.  It was going to be a narrow pathway for any Republican – Rubio, Cruz, Bush, Kasich or anyone else.

Clinton’s unpopularity.  As poorly as Trump has seemed to perform in the past ten days, Americans are not crazy about Hillary Clinton either.  Certainly, she has had an upswing, particularly with women, but she remains a juicy target for the Republicans.

Time.  Trump has lots of it.  Three months is a political eternity.  If he continues to death spiral, some speculate he might not even make it to November.  I wouldn’t rule it out, but the more likely scenario is that he regroups.

Stabilize.  Just a little less craziness would be a big momentum builder for the campaign.  Expectations are now so low for the Trump campaign that a solid week of on-message performance may completely change the narrative.  There are so many media cycles between now and November, and so much thirst by the cable news networks for content, that you could get the media to run with almost anything.

Clinton is in a much stronger position in terms of discipline, money, infrastructure, and the breadth of her coalition.  Yet Trump remains in striking distance.

So can Trump still win?  Yes.  We can look to countless examples of conventional wisdom being upended whether it was Justin Trudeau’s shocking majority government win only 60 days after he was in third place, the Brexit results, or the rise of Trump himself. He still has strong support among white voters and men.  The Democrats cannot afford to take their foot off the Trump campaign’s throat until it’s over.  Polls schmolls – you never know until the votes are cast.


Too Close To Call seat model was close enough in BC

One of the more interesting election websites is “Too Close too Call” – an election forecast site produced by Bryan Breguet, a Ph.D student in Economics at UBC.  I haven’t met him but admire his work.

It seems like he’s beating himself up a bit about his predictions today.  I took a spin on his seat forecasting model and inputted the actual popular vote numbers from BC.  His model extrapolates the final results fairly accurately.  Seat forecast models basically extrapolate the new pop vote numbers on a platform of the previous pop vote numbers (2011).

Here is the result:

Screen Shot 2015-10-21 at 2.05.47 PM

His accuracy is 81% (34 out 42).  Not bad.  That’s a B in most schools.

What interests me are the differences – why do some ridings break the pattern?

In BC, those eight ridings – based on Too Close too Calls model – are:

  • Cloverdale-Langley City
  • Coquitlam-Port Coquitlam
  • Kelowna – Lake Country
  • Kootenay-Columbia
  • Mission-Matsqui-Fraser Canyon
  • Pitt Meadows-Maple Ridge
  • Richmond Centre
  • South Surrey-White Rock

I will offer a theory:

  • These were all CPC seats to begin with
  • Five of eight seats did not have an incumbent seeking re-election.  (Conservatives lost 4 of 5 with new candidates)
  • The Conservatives won two of the seven outliers
    • Richmond Centre – bucked the trend for the CPC because of incumbency advantage.  Possibly retaining stronger support among Chinese.
    • Dianne Watts bucked the trend in South Surrey because she was a much better candidate for CPC than her predecessor.
  • Kootenay-Columbia was going to be close under these circumstances, though the NDP outperformed there, defeating a CPC incumbent in a squeaker.
  • Kelowna-Lake Country was a Liberal surprise, perhaps reflecting changing demographics in BC’s most urbanized Interior City.

Candidates make a difference, especially incumbents.  A closer look at popular vote per riding based against the model would show this too, but it’s the winning and losing that matters most.

To predict, or not to predict …

Let’s start my election prediction with a little bit of Hamlet:

Now whether it be
Bestial oblivion, or some craven scruple
Of thinking too precisely on th’ event—
A thought which, quarter’d, hath but one part wisdom
And ever three parts coward—I do not know
Why yet I live to say this thing’s to do,
Sith I have cause, and will, and strength, and means
To do’t.

In other words, I’m pretty sure I am overthinking this election!

I have written about many aspects of polling over the course of this election and will apply them to what we may see tonight.

I’m going to borrow from the poll aggregator 308 to show the trends in this election and the aggregated outcome.  The Liberals separated from the NDP around September 20th and never looked back while the Conservatives held steady but never able to grow their market share (according to the polls).

Screen Shot 2015-10-19 at 10.48.24 AM

Polls schmolls.  They are often wrong.  Even the blended numbers provided by the aggregators  have been wrong time and again.

Here are factors I apply to these numbers:

  • Turnout by age – older people vote at a higher level.  This is a traditional Conservative advantage.  Some polls (EKOS, ANGUS REID INSTITUTE) show an age advantage, but others (NANOS) are showing the Liberals with big gains among seniors.  Moreover, with increased voter turnout, which is likely to happen this election, the proportion of seniors as an overall share of the electorate will likely drop.  It will still be significant and have the highest turnout rate, but the gap between seniors and younger voters won’t be as dramatic.

Screen Shot 2015-10-19 at 10.56.07 AM

  • Shy ConservativesScreen Shot 2015-10-12 at 11.08.00 PMwe saw this in spades in the UK where no one detected a David Cameron majority.  All the polls suggested ‘Hung Parliament’ yet the Cameron Conservatives triumphed in stunning fashion.  Part of this may relate to “won’t says” – the estimated 8% of voters who just won’t cooperate on surveys when asked the ballot question.  My view is that they probably skew Conservative.  There is also a theory that people stick with the incumbent and “hold their nose” if they are fearful of the alternative.  In BC, we used to call them “10 second Socreds”.
  • Cultural Bias – My view is that media polling does not accurately reflect Canada’s diverse multicultural population.  Those who struggle with English are much less likely to cooperate in a telephone, IVR, or online panel.  In fact, online panels are the least representative, culturally speaking, unless they are done in-language.  There can be major differences in perspective culturally and they, ideally, should be reflected in polling.  I wrote about this recently with regard to the Chinese-Canadian community.  In BC, Chinese make up about 10% of provincial electorate and about 20% in Metro Vancouver – a huge factor.  My view is that the under-representation of Chinese in BC likely means Conservative support is under-represented.  I have seen no data in this election that tells us what’s going on in this community specifically.
  • Ambivalent respondents –

    Some survey respondents really don’t have a clue… and some still use flip phones!

    Innovative Research Group has done interesting research on those who answer survey questions.  There is a continuum between strongly consistent to strongly ambivalent.  The Conservatives do better among consistent respondents (ergo likelier voters) and weaker on ambivalents.  Angus Reid Institute had similar findings along the lines of vote firmness.  See my post on “Why Conservatives have hope”.  Liberal support has been growing among consistent respondents.

  • Gut – What does the tummy feel?  Hamlet would have had a real quandary figuring out these poll results.  The problem with the gut is that has a built in bias based on the echo chamber it lives in.  I am wondering if I’m drinking too much of my own bathwater, but my gut is pulling me in directions based on conversations with family and friends, and seeing indicators that may show how voters are behaving that are not reflected in the polls.  A big gut check is momentum.  That is something that Nanos has detected in the final three nights of polling.  Liberals on the rise.  Is it real?  I’m consulting my gut.

When I think about election surprises over the past few years, I’m comparing this election to those.  What is lacking in this election for the incumbent Conservatives is an overall narrative that gives voters a positive vision.  Negativity is an important part of campaigns – or you can call it contrast.  Parties are fighting over market share and the market has a ceiling of 100%.  It’s a zero sum game.  Parties must contrast themselves from their competition.  I have no problem with that and you can go back to the 1800’s for examples that would make today’s ‘attacks’ pale by comparison.  However, there must be a either a strong vision for the future, a stark choice, or a sense of renewal and change.

In both Alberta 2012 and BC 2013, these were female premiers in their first general election.  They were new, different and both were offering a proposition to voters.  In Alison Redford’s case, she was contrasting against a more conservative Wildrose brand and she was proposing to address issues on the progressive side of the ledger.  Christy Clark put forward an economic vision based built on a platform of fiscal responsibility that contrasted sharply with the NDP.  In the UK, David Cameron morphed fear of the Scottish Nationalists and the perceived weakness of the UK Labour leader to drive English Liberals to the Conservatives.  The reasons, in hindsight, are apparent for those election surprises.  I don’t see it here.  The case for Conservative re-election has seemingly slipped away over the last week.  While it may have been too late in the campaign to change much, the Ford family-Stephen Harper photo op on the weekend may have provided an added push for “time for change” Tories to jump ship.

The Upshot

While there are many factors – turnout, cultural, and polling bias – that mitigate in favour of a better Conservative outcome – which I am accounting for, my gut pulls me in the other direction.  I believe “red Tories” and soft NDP voters are going Liberal and the polls are seeing a glimpse of that.

Prediction

I’m throwing away the calculators and the models and the spreadsheets.

Hearkening back to Hamlet, three parts cowardice, one part wisdom would have led me to predict a Liberal minority.  I have put aside the cowardice and perhaps the wisdom, and decided to be bold.

I don’t think Canadians are going to be wishy washy tonight.  I think it’s a Liberal majority… by a hair (which would be ironic… “nice hair” they’ll say).

And though 38.5% has been the minimum to attain a majority in past 60 years, I think the Liberals may do it with less this time because of the vote splits.

The math for the Libs:

Atlantic and West/North:  50 seats

Ontario and Quebec:  120 seats

Libs 170

In BC, I think the NDP have jumped the shark.  Bringing out warhorse Stephen Lewis, last seen promoting the Leap Manifesto, to stump shows they are doubling down on their core vote.  The Liberals are going to win some seats that no one, including them, thought they had any business of winning.

BC seat count:

Libs 15

CPC 14

NDP 11

GREENS 2 (yes, not sure if it’s Victoria or Nanaimo)

This post will not impact a single vote so it’s all just fun and games.  When we are sitting around tomorrow reading about a shocking Conservative win, I will begin my tour of shame with my Conservative friends who will no doubt remind me of this post forever more.

Prediction market bearish on NDP, but has been fooled before

The Sauder School of Business is running its prediction market yet again, as it has done in many previous elections.  Real people invest real money on the outcome of the election.

It’s a bear market for Les Oranges

In the past day, there has been a run on the market.  Investors are scooping up “Liberal majority” government shares.  If the Liberals win a majority, one share = $1.  If they don’t, the share is worth nothing.  The Majority Government Market betting is an all-or-nothing proposition.

Screen Shot 2015-10-14 at 10.39.49 AM

Liberal majority government shares have moved from a low of 7 cents on the dollar to 23 cents.  Conservative majority shares have declined to 3 cents.  NDP majority shares are now at less than half a cent.  That’s a pretty good windfall if the Orange ship comes in.

The minority government (“any other outcome”) option has risen from the low 60s a few weeks ago to 82 cents.  Still, a decent return of over 20% if that outcome is realized.

The popular vote market shows Liberal shares being traded at 38 cents with the lowest asking price at 42 cents.  The market is very bullish for the Liberals; surprising then that the majority government betting for the Liberals isn’t higher.  But are bettors getting ahead of themselves ?

Screen Shot 2015-10-14 at 11.27.34 AM

I have observed in recent years that this market mirrors media coverage of poll results, though with the added touch that people have to put their money where their mouth is.  It’s an interesting social experiment but it doesn’t necessarily predict outcomes.  The poll results are likely too dominant a consideration in investors’ behaviour.

Here are the statistics of the last day of trading prior to the BC provincial election in 2013:

Screen Shot 2015-10-14 at 11.32.35 AM

In the meantime, you still have time to make some money off of other political junkies.  There are doubtlessly some emotional bettors that will part with their hard-earned cash on Tuesday.

Reasons to second guess polls

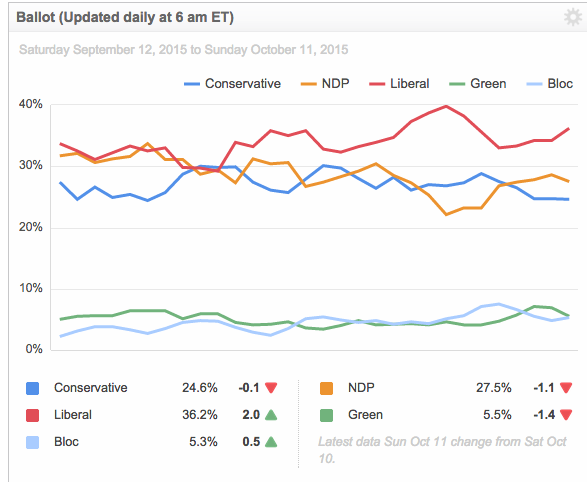
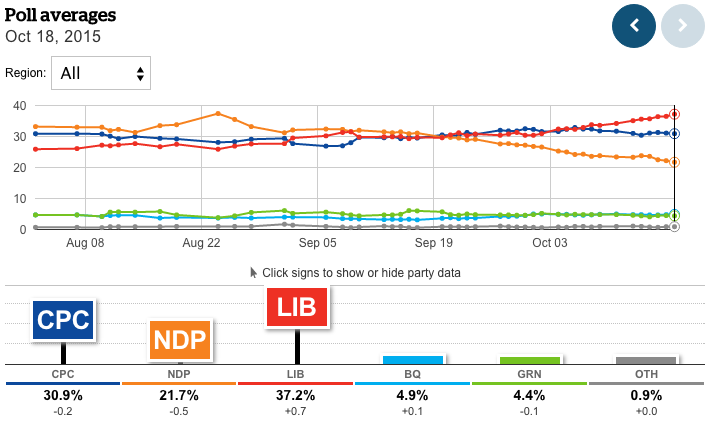
The latest polls give plenty of fodder to suggest that there is a Liberal surge overtaking the race.  There are a number of supportable points on this:

  • Nightly poll tracking by Nanos has been reinforced by Innovative and Ekos.  The narrative is that the Liberals are pulling away from the Conservatives with the NDP far behind.
  • The “not ready” line of attack has been embraced by the Liberals; they have played it differently than “just visiting” and “not a leader” attacks from previous campaigns.
  • The heat of the anti-Harper passion is far beyond that what has been seen in previous elections.  Various poll metrics (eg. “time for a change”) suggest voters are ready for a new government.
  • Advance voting turnout is high which could mean higher overall turnout favouring the Opposition.

What could possibly go wrong betting on a horse race?

Yet, there is that gnawing feeling that there could be another polling surprise just around the bend.
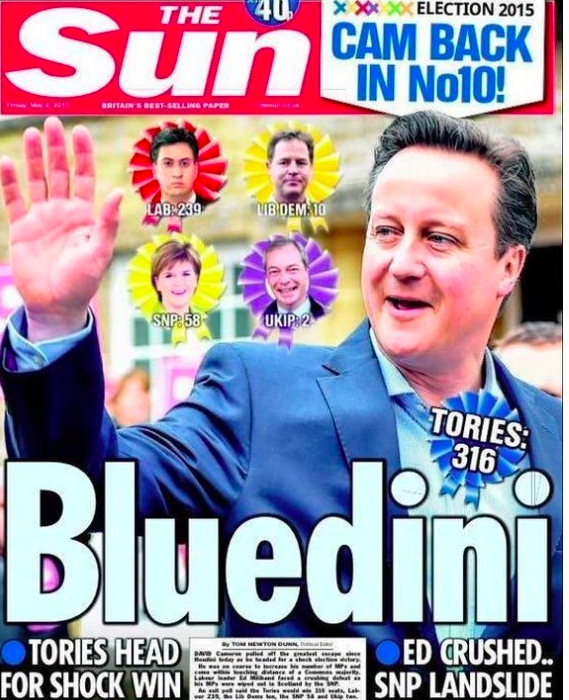
Look at the UK election last May.  Screen Shot 2015-10-12 at 11.08.00 PMThe intensity of British media coverage and polling exceeded that of the Canadian election yet no one saw a Conservative majority coming.  Even famed predictor Nate Silver blew it badly.  When BBC forecasted a majority moments after polls closed – based on results from exit polls – pundits were absolutely gobsmacked.  Not only that, two of the party leaders were caught with their pants down by their ankles and resigned by morning.  The prime minister (“Bluedini”) was likely as surprised but had the winning strategy on his side.  (Exit polls were based on interviews with voters immediately after they voted, not pre-voting surveys)

Yes, there is the litany of Canadian surprises too.  Mainly favouring incumbents – Christy Clark, Alison Redford, Greg Selinger, Dalton McGuinty, and Kathleen Wynne to name some plus Jean Charest who just missed re-election when pollsters had him in third.  Remember Doug Ford?  The final polls in the Toronto mayor’s race had him dead and buried but he only lost by 6.5%.  Overall, it’s certainly not a sterling track record.  I’m speaking about media polls here.  Sure, some parties have got it wrong too, but clearly some (the winners) are getting it right.

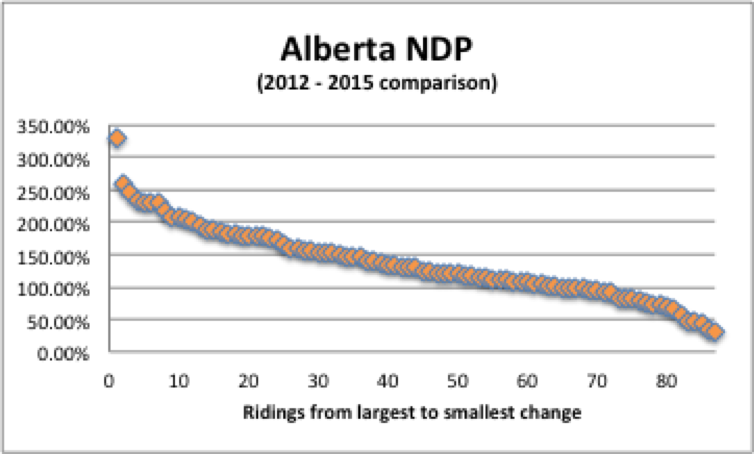
But they called it in Alberta, right?  A quick check from the 308 poll aggregator site shows that most pollsters (not all) overstated NDP support and understated PC support.  It didn’t matter since the NDP won handily.  But in a close election, some of the pollsters were off by a considerable margin when you look at the NDP-PC difference.  The poll aggregator had that gap at 20 points (it was 13%).  That’s a big difference in a close election and an error of similar magnitude in this election would lead to a different outcome.

Screen Shot 2015-10-12 at 10.23.41 PM

Three things I’m watching

  1.  The engagement level of voters

Last week, I wrote about Greg Lyle’s extensive research.  He updated his research this week with a research deck of over 100 pages.  There is enough data here to keep Wikileaks busy for a month.  Overall, his survey reported a 35-30-24 race (Lib – CPC – NDP).

Screen Shot 2015-10-12 at 10.30.49 PM
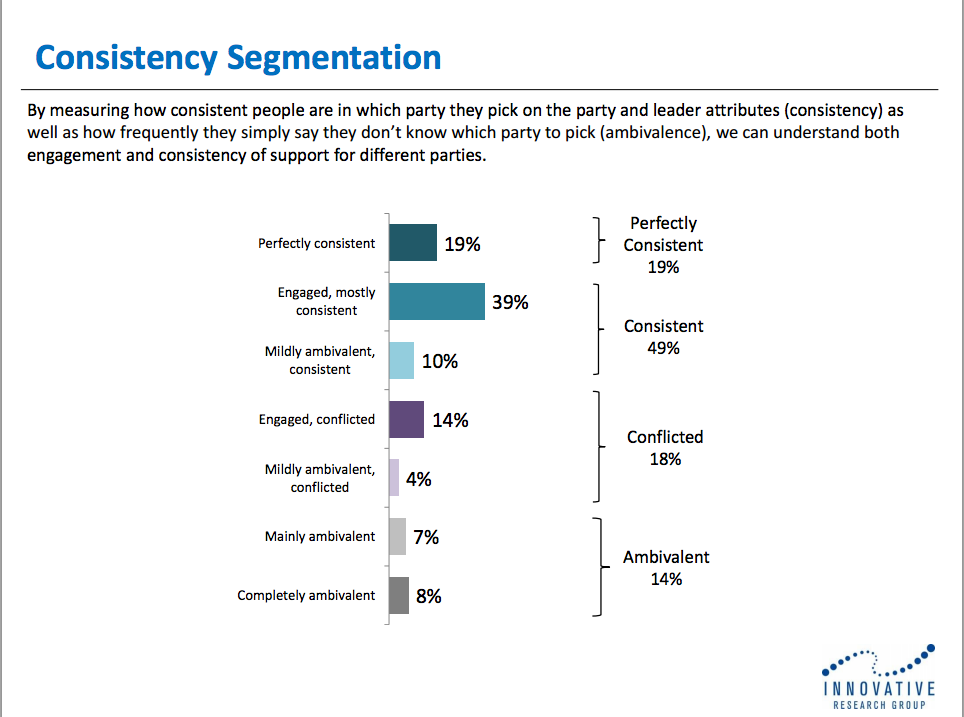
Greg has built a respondent profile based on consistency versus ambivalence.  If the respondents have a consistent pattern to their responses, they are at the ‘consistent’ end of the scale.  If they answer “don’t know” to a lot of questions, they are on the ‘ambivalent’ end of the scale.  Conflicted respondents are in the middle.

About 15% of respondents are ambivalent.  Most will not vote.The ‘perfectly consistent’ are primed to vote.

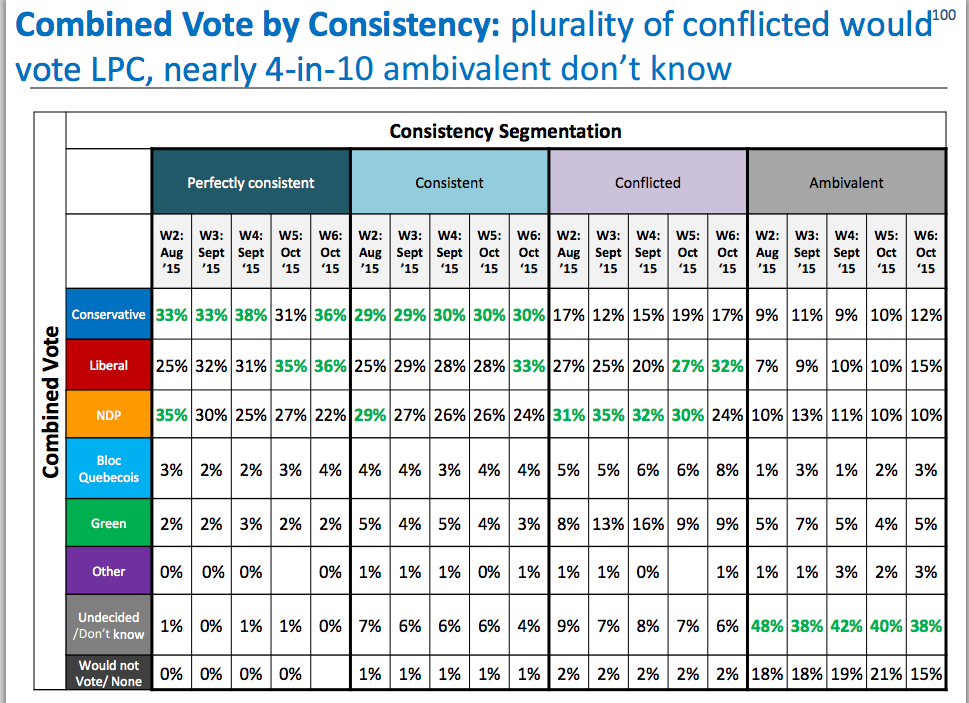
This week, Greg posted the vote results by each of these clusters.  Bearing in mind the Liberals had an overall five-point lead on the CPC, here’s how that broke down among the consistency segmentation:

Screen Shot 2015-10-12 at 10.30.25 PM

The race is tied among the ‘perfectly consistent’.  I would throw out the 15% of ambivalent respondents, which shaves a fraction off the Liberal lead.  Among the 18% of ‘conflicted’ voters, the Liberals have a substantial lead over CPC, which appears to be based on NDP switchers (hence the fact they are ‘conflicted’). These respondents are a lot more likely to vote than ‘ambivalent’ but less likely than consistent voters.

Therefore, the Liberals have more work to do to mobilize this voter group in order to realize a five-point win.

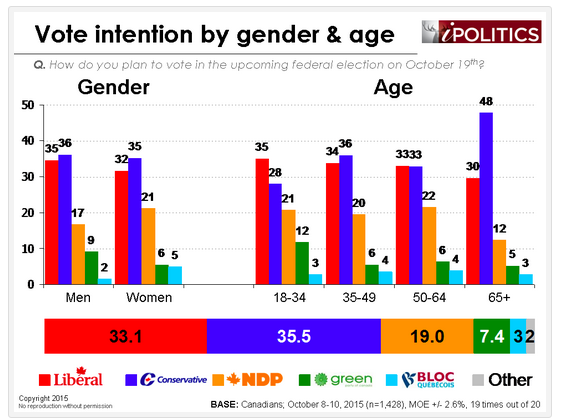
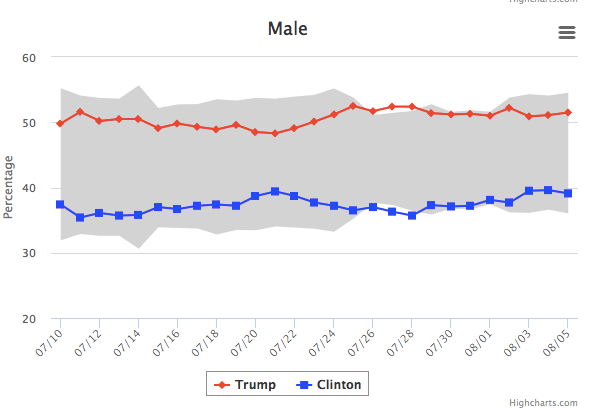
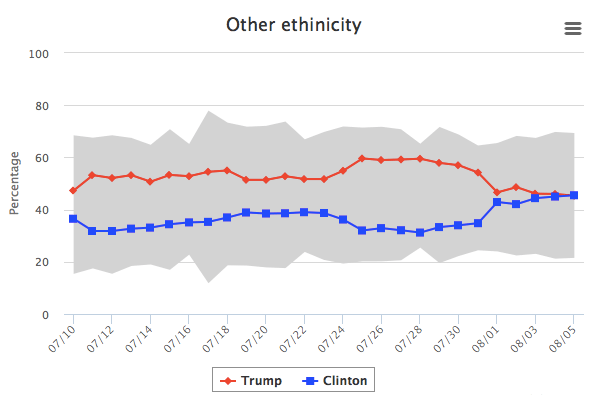
         2.  Inconsistencies between pollsters in age and gender

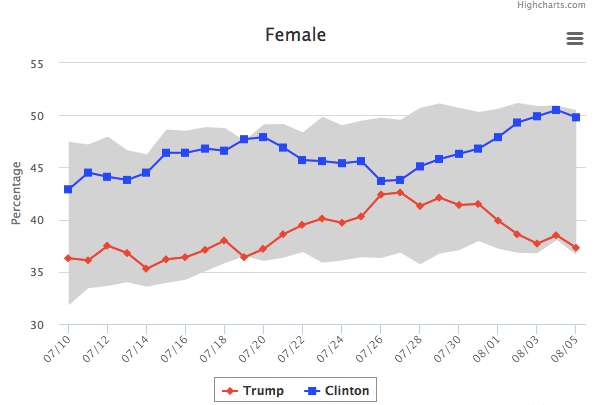
There has traditionally been a gender split with the Conservatives doing better among men and the Liberals doing better among women.  Ekos, which had the Conservatives ahead two points, shows the Conservatives leading among women.

Screen Shot 2015-10-12 at 10.46.40 PM

Meanwhile, Nanos in the field at the same time, has the Liberals with an 11.6% lead among women.  That’s a pretty big gap between pollsters.

nanos female
Is Ekos overestimating CPC support through a blip in female support, or is Nanos overestimating Liberal support among males (below).  Nanos has shown a consistent Liberal uptick.

Screen Shot 2015-10-12 at 10.44.51 PM

Oh, and did you see the Ekos age split?  48-30 for CPC among seniors.  Nanos has the Liberals with a 1.5% lead among plus 60 voters.  Again, another big difference.  Who’s right?  I dunno.

        3.  Regional races

There is considerable variance in the regional horse race numbers, especially in Ontario and Quebec.

In Ontario, it is either a death-duel between the Blues and the Reds OR it’s the Reds walking away.

In Quebec, it is either a four-way collision or the NDP retain enough support to win the majority of seats, keeping it in national contention.  When you see numbers like this, the party above 30% can harvest a lot of seats.  The difference in Quebec between 27% and 32% could be 40 seats.  The latest poll findings are inconclusive, to say the least.

308 Leger Nanos IRG Forum ARI
NDP 30% 28% 33% 29% 25% 31%
LIB 27% 28% 29% 26% 29% 24%
CPC 19% 20% 14% 19% 22% 17%
BLOC 21% 23% 23% 22% 21% 27%

Finally, there are the usual warnings:

  • 10-second Tories (in BC, we called them 10-second Socreds).  Voters that decide in the final analysis to hold their nose and vote for the incumbent.
  • “Cranky won’t says” – the 6-8% of voters who won’t and don’t cooperate on surveys are a statistical wildcard.
  • The final weekend – voters have a sixth sense that is not entirely detectable.  The Redford win in 2012 manifested from an unease about Wildrose in the final week.  A combination of not-likely voters, strategic voters, and strange bedfellows changed the game.
  • Advance and special votes – Perhaps up to 20% of votes are already in the bag.  Who do they favour? Will the winner on October 19th lose the overall election?

I’m not forecasting anything here – only caution.  It is clear that the Liberals have won the campaign thus far.  They started with low expectations and have exceeded them, and have to this point eclipsed the NDP in the ‘primary’ that established which party had the best chance to defeat the Conservatives.

Having said that, if I was a Liberal strategist, I would be tempering my grassroots’ naturally-occurring public-poll-based-optimism with Eeyore-like gloom and insist they are still running from behind.  I wouldn’t want to be like the gobsmacked Brit who couldn’t read the tea leaves – even at tea time.  If I was a CPC strategist, I wouldn’t assume the poll numbers will necessarily improve – it is going to be a gruelling week but a plurality is very much possible if they have a strong finish, particularly with the likeliest of voters.  If I was an NDP strategist, I would move mountains to move vote in Quebec.  If they lose Quebec, all is lost.

Ultimately, the great thing about campaigns is that it’s up to the voters.  The strategic voting organizations, the media outlets, and the pundits are not inside the voting booth.  It’s between the voters and the names on the ballot.  And that is the greatest variable – voters just damn well choose who they want to, sometimes with surprising results.

Seat models: Moneyball for the peanut gallery

With the the onset of daily polling binges, seat projections are the pundit’s version of ‘Moneyball’, casting aside the political gut much like Billy Beane of the Oakland A’s cast aside the grizzled, old, tobacco chewing baseball scouts.

Billy Beane (Brad Pitt) tells the pundits to stop using their guts and start using the darn seat model.

There are a variety of seat predictors such as CBC polltracker via 308 and one from the Sauder School at UBC, which runs a cash-on-the-barrelhead stock market predicting election results.  The Globe & Mail seat model is so fanciful that my computer almost overheated from the excitement.  It’s a Mac so everything was fine.

In a nutshell, seat models take the national or regional polling numbers and apply them to individual ridings.  So, if a party received 30% of the vote last election across Canada or a region, and, this time that party is at 33%, then the results in each riding would be adjusted up by a proportionate amount.  That’s the general idea.

Seat models work great!  Except when you look at past election results.

In a two-way election where there is not much change between elections, they can be a useful predictor.  A party’s strong and weak ridings tend to stay that way in stable political landscapes, allowing parties to focus on their battlegrounds.

Seat models do not account, however, for disruption.  I took a look at two recent provincial elections to show just how much disruption actually occurs.

Let’s look at BC in 2009 and 2013.  The riding boundaries were unchanged so there is a good apples to apples comparison.

Despite my best efforts, the popular vote for the BC Liberals went down from 45.82% to 44.13%; the NDP vote declined from 42.15% to 39.72%.  Therefore, the BC Liberal vote was 96.3% of 2009 and the NDP vote was 94.2% of 2013.  That doesn’t seem like a lot of change.

Thus, a seat model would forecast that BC Liberal riding popular support would be about 96.3% of their 2009 levels.  My review shows a considerable variance in both parties where about a third of the ridings deviated by a significant amount from the average.  One riding (Peace River North) bucked the provincial trend by 17% to the positive  for the BC Libs and another trailed the provincial trend by 15% (thanks for that, Andrew Weaver).

BCL 2013 model diff

Similarly with the NDP, about a third of their ridings were more than 5 points off the provincial trend – some ridings exceeded the provincial trend (Vancouver-False Creek, Penticton though they still lost) while one riding was 25 points below the provincial trend, due to local conditions.

NDP 2013 model diff

While strong third party candidacies explain some anomalies, there was also a shift in the provincial landscape afoot.  The BC Liberal support base consolidated in the suburbs and BC Interior- the party picked up five new seats in these regions.  The trade-off was diminished support in the City of Vancouver and South Island, where the NDP picked up 3 of 4 of their gains, along with one Green.  Seat models miss this type of dynamic.  Things do change over time – California now votes Democrat, Alabama now votes Republican.  Seat models freeze the paradigm of the previous election.

BC was a piece of cake compared to the 2015 Alberta election.  The NDP zoomed from 9.85% to 40.57% in one single leap.  That’s a 411% increase in their support.  Their average riding should have increased, according to a seat model, by over 4x based on 2012.  Of course, this is silly, because in existing strong seats, they were not going win with 150%.  How do the votes disperse then?

Basically, they did do very, very well in their stronghold, Edmonton, sweeping the city with huge margins, but they already had a base there.  The biggest NDP gains compared to their provincial average gain were in Calgary.

alberta ndp diff model

In the chart above, 100% equals the NDP average increase, which was a 411% increase in vote. That means 350% on the scale is a 14x increase, if you follow.

Here are the five Alberta ridings that doubled the provincial trend, meaning the increase in NDP vote was 8x or more compared to 2012.

  • Calgary-McCall (from 2.2% to 29.9% and a win)
  • Calgary-Greenway
  • Calgary-Hays
  • Calgary-Northwest
  • Calgary-Varsity

The five seats that varied the least from the model were all NDP wins – 4 in Edmonton and 1 in Lethbridge.  They only went up about 12% to 17% in popular vote, but they simply couldn’t do much more in terms of cleaning up support.  The vote was already there.

What’s the point?

This federal election is going to see a lot of volatility compared to 2011.  The Liberal vote, for example, looks like its going to be a lot higher than its previous paltry 18%.  Does the red tide lift all boats equally?  No, to quote a Greek pollster – it will be ‘lumpy’.

There are sub-plots abound, and where parties make big leaps, the math doesn’t work evenly.  Seats that show up as wins for some parties according to seat models are very unlikely to happen.  And believe it or not, candidates matter too.

You won’t find “Moneyball” voter data through the media polls.  It’s held closely in the data rooms and strategy tables of the major parties (not you, Greens) who spend millions contacting voters.  Those of us on the outside will have to chew some tobacco, judge the velocity of the pitches, and make our own assessments based on the polling morsels left to us.  We will have to use our guts.  After all, people cast their votes, not seat models (Thank God).  While pollsters and pundits breathlessly predict outcomes, pick up some peanuts and crackerjacks, sit back and enjoy the game.

Predictions: putting your money where your mouth is

Are you convinced there will be a minority government?  Put your money where you mouth is.

The UBC Sauder School is running a predictions market again where participants invest their own cash (up to $1000) to bet on the outcome of the election.  Anyone can register and invest.

As of August 11, a minority government will yield $1.00 if it is purchased at today’s price of 58 cents.  Not a bad return.  An even better return is a Conservative majority.  You can buy that share for 17 cents today for a $1.00 payoff.  600% return.  Of course, if it doesn’t happen, you lose your investment.

The popular vote market closely follows the public polls.  Intuitive campaigners can make a few bucks if they foresee polling inaccuracies or can see through emotional betting.