With the the onset of daily polling binges, seat projections are the pundit’s version of ‘Moneyball’, casting aside the political gut much like Billy Beane of the Oakland A’s cast aside the grizzled, old, tobacco chewing baseball scouts.

Billy Beane (Brad Pitt) tells the pundits to stop using their guts and start using the darn seat model.
There are a variety of seat predictors such as CBC polltracker via 308 and one from the Sauder School at UBC, which runs a cash-on-the-barrelhead stock market predicting election results. The Globe & Mail seat model is so fanciful that my computer almost overheated from the excitement. It’s a Mac so everything was fine.
In a nutshell, seat models take the national or regional polling numbers and apply them to individual ridings. So, if a party received 30% of the vote last election across Canada or a region, and, this time that party is at 33%, then the results in each riding would be adjusted up by a proportionate amount. That’s the general idea.
Seat models work great! Except when you look at past election results.
In a two-way election where there is not much change between elections, they can be a useful predictor. A party’s strong and weak ridings tend to stay that way in stable political landscapes, allowing parties to focus on their battlegrounds.
Seat models do not account, however, for disruption. I took a look at two recent provincial elections to show just how much disruption actually occurs.
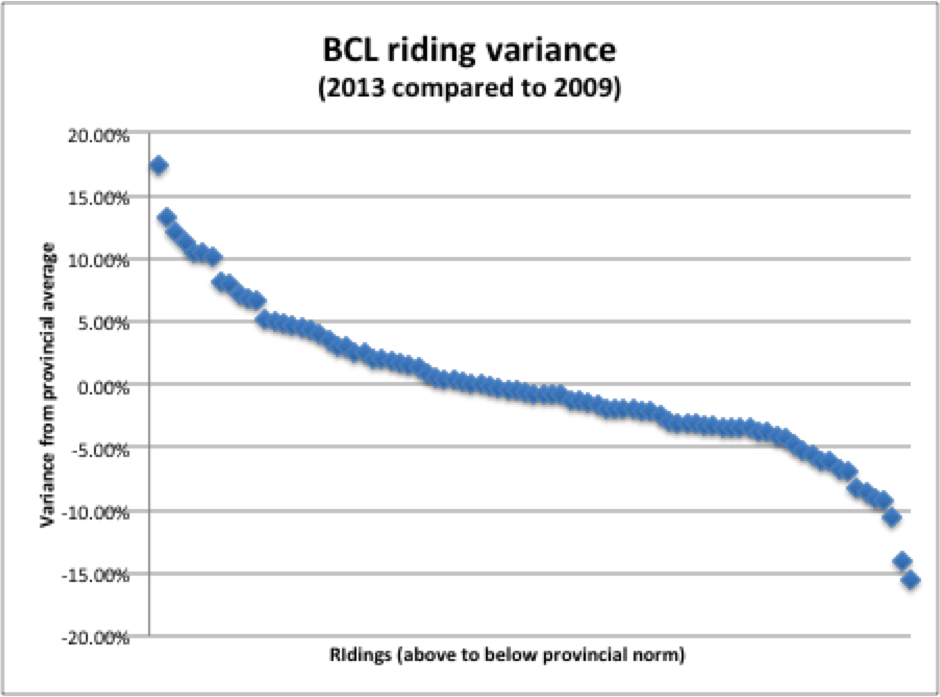
Let’s look at BC in 2009 and 2013. The riding boundaries were unchanged so there is a good apples to apples comparison.
Despite my best efforts, the popular vote for the BC Liberals went down from 45.82% to 44.13%; the NDP vote declined from 42.15% to 39.72%. Therefore, the BC Liberal vote was 96.3% of 2009 and the NDP vote was 94.2% of 2013. That doesn’t seem like a lot of change.
Thus, a seat model would forecast that BC Liberal riding popular support would be about 96.3% of their 2009 levels. My review shows a considerable variance in both parties where about a third of the ridings deviated by a significant amount from the average. One riding (Peace River North) bucked the provincial trend by 17% to the positive for the BC Libs and another trailed the provincial trend by 15% (thanks for that, Andrew Weaver).
Similarly with the NDP, about a third of their ridings were more than 5 points off the provincial trend – some ridings exceeded the provincial trend (Vancouver-False Creek, Penticton though they still lost) while one riding was 25 points below the provincial trend, due to local conditions.
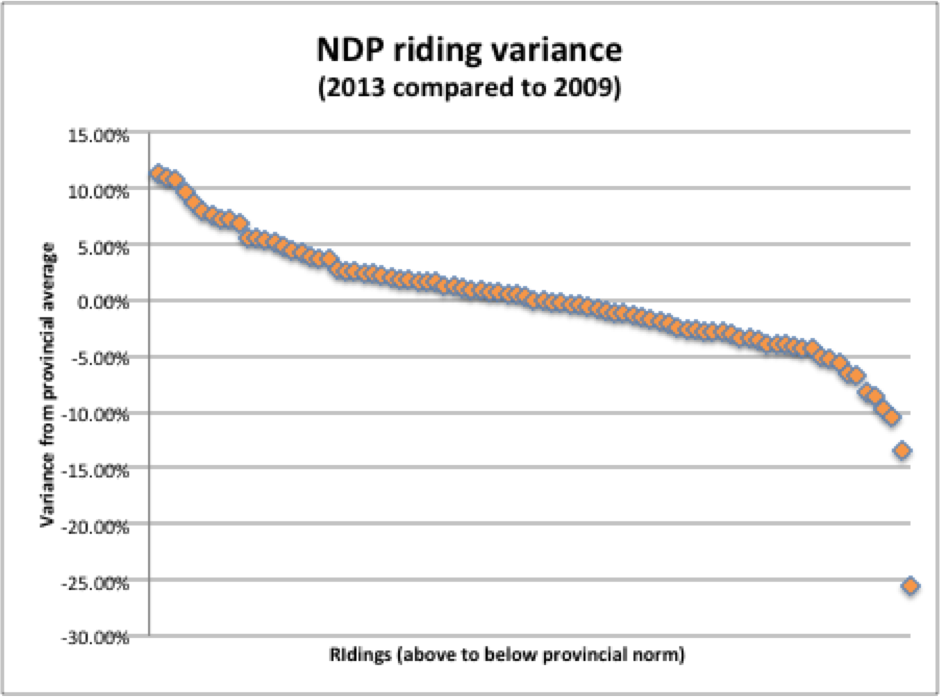
While strong third party candidacies explain some anomalies, there was also a shift in the provincial landscape afoot. The BC Liberal support base consolidated in the suburbs and BC Interior- the party picked up five new seats in these regions. The trade-off was diminished support in the City of Vancouver and South Island, where the NDP picked up 3 of 4 of their gains, along with one Green. Seat models miss this type of dynamic. Things do change over time – California now votes Democrat, Alabama now votes Republican. Seat models freeze the paradigm of the previous election.
BC was a piece of cake compared to the 2015 Alberta election. The NDP zoomed from 9.85% to 40.57% in one single leap. That’s a 411% increase in their support. Their average riding should have increased, according to a seat model, by over 4x based on 2012. Of course, this is silly, because in existing strong seats, they were not going win with 150%. How do the votes disperse then?
Basically, they did do very, very well in their stronghold, Edmonton, sweeping the city with huge margins, but they already had a base there. The biggest NDP gains compared to their provincial average gain were in Calgary.
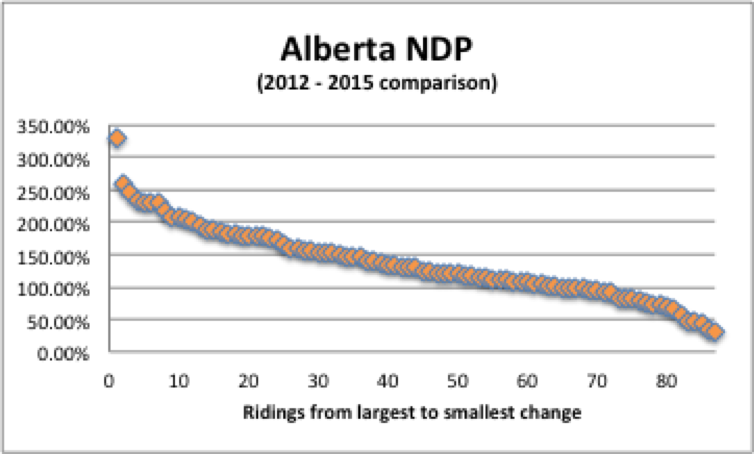
In the chart above, 100% equals the NDP average increase, which was a 411% increase in vote. That means 350% on the scale is a 14x increase, if you follow.
Here are the five Alberta ridings that doubled the provincial trend, meaning the increase in NDP vote was 8x or more compared to 2012.
- Calgary-McCall (from 2.2% to 29.9% and a win)
- Calgary-Greenway
- Calgary-Hays
- Calgary-Northwest
- Calgary-Varsity
The five seats that varied the least from the model were all NDP wins – 4 in Edmonton and 1 in Lethbridge. They only went up about 12% to 17% in popular vote, but they simply couldn’t do much more in terms of cleaning up support. The vote was already there.
What’s the point?
This federal election is going to see a lot of volatility compared to 2011. The Liberal vote, for example, looks like its going to be a lot higher than its previous paltry 18%. Does the red tide lift all boats equally? No, to quote a Greek pollster – it will be ‘lumpy’.
There are sub-plots abound, and where parties make big leaps, the math doesn’t work evenly. Seats that show up as wins for some parties according to seat models are very unlikely to happen. And believe it or not, candidates matter too.
You won’t find “Moneyball” voter data through the media polls. It’s held closely in the data rooms and strategy tables of the major parties (not you, Greens) who spend millions contacting voters. Those of us on the outside will have to chew some tobacco, judge the velocity of the pitches, and make our own assessments based on the polling morsels left to us. We will have to use our guts. After all, people cast their votes, not seat models (Thank God). While pollsters and pundits breathlessly predict outcomes, pick up some peanuts and crackerjacks, sit back and enjoy the game.
