Wakey wakey. This election may be baked by Monday.

Wakey wakey.  It’s almost 10/09… time to vote.  Advance polls open October 9-12.

More and more voters are setting their alarm clocks to vote in advance polls.

In BC’s 2013 election, advance voting rose to over 20% of all votes cast.  A sharp rise over five successive elections when only 5.74% voted in advance (1996).

Screen Shot 2015-10-07 at 9.31.03 PM

In Alberta, advance voting jumped from 14% to 16% from 2012 to 2015.  Why are people voting earlier?  Convenience? Increased efforts by political parties to lock up the votes?

It’s kind of a thing with older people.  Elections Canada also reports a rising trend of advance voting between 2004-2011.   Those keenest to vote early are age groups that are the likeliest to vote.  Federally, 5% of 18-24s voted early compared to 17% of 65-74s.  After that morning coffee at Tim Horton’s, why not round up the pals and go vote?

Screen Shot 2015-10-07 at 9.30.42 PM

So, older people are keen to vote early and they are keen to vote often.  My estimate – back of envelope – is that over three-fifths of advance voters are beyond age 55.

An interesting strategic issue is at play.  If advance voters are disproportionately older – even moreso than overall turnout stats – then the voting population on Election Day (October 19) will be more balanced by age.

The voters heading to the advance voting stations this weekend – once they vote – they are done.   The advertising and media that bombards them in next 24-96 hours will have done its work – one way or another – and those votes will be locked up.  Maybe it will be 20% of the electorate, like BC, but whatever the amount, it will be well over a million voters.

Of the remaining voters, younger voters will be more important proportionally, so will messaging be tweaked?  We’ll have to see.

Political parties are more sophisticated than ever in mobilizing voters.  Social media will play an increasing role this time.  Canadian political parties are learning from mobilization techniques that have proven highly successful south of the 49th where early voting is an even bigger thing.

The recent polls are unclear who’s really winning this election.  Is it a clear Conservative lead as some suggest or a tight Liberal lead as others purport?  And what about Quebec voters – will they show up en masse for advance polls or wait and see?  The Conservatives will look to put a stranglehold on the race by encouraging the Grey March to the polls.  The Liberals will try compete among seniors in the advance poll, thereby undermining what should be a Conservative edge.  Either way, the votes cast by turkey time will be a huge advantage for the party with momentum heading into a long, political weekend.

Polling Pig-a-thon: 4 polls, 4 plots

An abundance of polls were released into the media trough today.  Political observers are pigging out.  It’s hard to make sense of the numbers amidst the contradictory squeals – so here’s a quick breakdown below.

Four polls, four plots.  Different methodologies, sample sizes, and outcomes.

Pollster Method CPC LIB NDP CPC Lead
MAINSTREET IVR, n=5197 37 29 24 8
EKOS IVR+Live, n=1658 35 31 22 4
IPSOS Panel, n=1441 33 32 26 1
NANOS Live, n=1200 31 36 23 -5

Mainstreet was the best for CPC with an 8-point lead.  Conducted September 30-October 1 it is arguably a bit stale but does have a very large sample.

  • Standout stats – Has CPC with a 7-point lead among women.  This is very different from Nanos which has a 13-point lead among women for Liberals.  Has 10-point CPC lead in Ontario while others have marginal lead for Liberals.

Ekos shows a 4-point CPC lead.  In field October 3-5 with combined IVR / live phone methodology (about 2/3 IVR) with second largest sample size.

  • Standout stats – Conservatives tied for lead in Quebec with NDP at 28%.  NDP with 9-point lead in BC.  60% for Libs in Atlantic is highest by 10-points.

IPSOS shows a dead heat.  In field October 2-5 with its online panel.

  • Standout stats – NDP closest to the front of the pack than any other poll – at 7-points.  IPSOS has an almost even gender split for CPC and Libs, which is uncommon.  Libs tend to do better with women, CPC with men.  Lib 17-pt lead among under 35’s would suggest turnout challenge, if accurate.

Finally, Nanos has the Liberals up by almost five points over CPC.  A gathering trend over the past few days.  Nanos conducts 400 live telephone interviews each day, combining them into a rolling track of a sample size of 1200.

  • Standout stats – the national race is THE standout stat.  In addition, the CPC appear low in BC at 24% compared to 35% for Libs.  Libs have an 8-point lead among 50-59 year olds, sandwiched between CPC leads among 60+ and 40-49s.

I analyzed Nanos’s polling in this recent post.

What’s the upshot?

Only one conclusion – the NDP are huffing and puffing but can’t seem to blow down the two-way race (trying to work the pigs back into the story).

The sub-samples are inconsistent between the pollsters, which is commonplace considering the margins-of-error increase when you raise the hood.  There are many other sources of potential unreliability that relate to ongoing problems with pollster accuracy.

Here’s two previous posts that should give observers pause for thought:

Seat models: Moneyball for the peanut gallery

With the the onset of daily polling binges, seat projections are the pundit’s version of ‘Moneyball’, casting aside the political gut much like Billy Beane of the Oakland A’s cast aside the grizzled, old, tobacco chewing baseball scouts.

Billy Beane (Brad Pitt) tells the pundits to stop using their guts and start using the darn seat model.

There are a variety of seat predictors such as CBC polltracker via 308 and one from the Sauder School at UBC, which runs a cash-on-the-barrelhead stock market predicting election results.  The Globe & Mail seat model is so fanciful that my computer almost overheated from the excitement.  It’s a Mac so everything was fine.

In a nutshell, seat models take the national or regional polling numbers and apply them to individual ridings.  So, if a party received 30% of the vote last election across Canada or a region, and, this time that party is at 33%, then the results in each riding would be adjusted up by a proportionate amount.  That’s the general idea.

Seat models work great!  Except when you look at past election results.

In a two-way election where there is not much change between elections, they can be a useful predictor.  A party’s strong and weak ridings tend to stay that way in stable political landscapes, allowing parties to focus on their battlegrounds.

Seat models do not account, however, for disruption.  I took a look at two recent provincial elections to show just how much disruption actually occurs.

Let’s look at BC in 2009 and 2013.  The riding boundaries were unchanged so there is a good apples to apples comparison.

Despite my best efforts, the popular vote for the BC Liberals went down from 45.82% to 44.13%; the NDP vote declined from 42.15% to 39.72%.  Therefore, the BC Liberal vote was 96.3% of 2009 and the NDP vote was 94.2% of 2013.  That doesn’t seem like a lot of change.

Thus, a seat model would forecast that BC Liberal riding popular support would be about 96.3% of their 2009 levels.  My review shows a considerable variance in both parties where about a third of the ridings deviated by a significant amount from the average.  One riding (Peace River North) bucked the provincial trend by 17% to the positive  for the BC Libs and another trailed the provincial trend by 15% (thanks for that, Andrew Weaver).

BCL 2013 model diff

Similarly with the NDP, about a third of their ridings were more than 5 points off the provincial trend – some ridings exceeded the provincial trend (Vancouver-False Creek, Penticton though they still lost) while one riding was 25 points below the provincial trend, due to local conditions.

NDP 2013 model diff

While strong third party candidacies explain some anomalies, there was also a shift in the provincial landscape afoot.  The BC Liberal support base consolidated in the suburbs and BC Interior- the party picked up five new seats in these regions.  The trade-off was diminished support in the City of Vancouver and South Island, where the NDP picked up 3 of 4 of their gains, along with one Green.  Seat models miss this type of dynamic.  Things do change over time – California now votes Democrat, Alabama now votes Republican.  Seat models freeze the paradigm of the previous election.

BC was a piece of cake compared to the 2015 Alberta election.  The NDP zoomed from 9.85% to 40.57% in one single leap.  That’s a 411% increase in their support.  Their average riding should have increased, according to a seat model, by over 4x based on 2012.  Of course, this is silly, because in existing strong seats, they were not going win with 150%.  How do the votes disperse then?

Basically, they did do very, very well in their stronghold, Edmonton, sweeping the city with huge margins, but they already had a base there.  The biggest NDP gains compared to their provincial average gain were in Calgary.

alberta ndp diff model

In the chart above, 100% equals the NDP average increase, which was a 411% increase in vote. That means 350% on the scale is a 14x increase, if you follow.

Here are the five Alberta ridings that doubled the provincial trend, meaning the increase in NDP vote was 8x or more compared to 2012.

  • Calgary-McCall (from 2.2% to 29.9% and a win)
  • Calgary-Greenway
  • Calgary-Hays
  • Calgary-Northwest
  • Calgary-Varsity

The five seats that varied the least from the model were all NDP wins – 4 in Edmonton and 1 in Lethbridge.  They only went up about 12% to 17% in popular vote, but they simply couldn’t do much more in terms of cleaning up support.  The vote was already there.

What’s the point?

This federal election is going to see a lot of volatility compared to 2011.  The Liberal vote, for example, looks like its going to be a lot higher than its previous paltry 18%.  Does the red tide lift all boats equally?  No, to quote a Greek pollster – it will be ‘lumpy’.

There are sub-plots abound, and where parties make big leaps, the math doesn’t work evenly.  Seats that show up as wins for some parties according to seat models are very unlikely to happen.  And believe it or not, candidates matter too.

You won’t find “Moneyball” voter data through the media polls.  It’s held closely in the data rooms and strategy tables of the major parties (not you, Greens) who spend millions contacting voters.  Those of us on the outside will have to chew some tobacco, judge the velocity of the pitches, and make our own assessments based on the polling morsels left to us.  We will have to use our guts.  After all, people cast their votes, not seat models (Thank God).  While pollsters and pundits breathlessly predict outcomes, pick up some peanuts and crackerjacks, sit back and enjoy the game.

Carving up the Nanos results four ways

Heading into Thanksgiving weekend, Canadians will be carving up poll results.

One pollster in this campaign has provided daily results – Nanos Research.  No pollster is infallible – quite the opposite – but Nanos does provide a body of work to observe trends.

I decided to look at four aspects of Nanos’ work: the national race, regional races, age, and gender.

On methodology, unlike a lot of other pollsters, these are live telephone interviews.  The sample includes land lines and cell phones.  The data is weighted but the weights are not unreasonable.  Nanos completes 400 interviews per night and reports a rolling three-day result (n=1200) each day, which smooths out the bumps if there are anomalies.  Once you break the data down into subsets, margins of error rise, so bear that in mind.  Overall, it’s a robust program.  Larger sample sizes would be ideal, but beggars can’t be choosers.

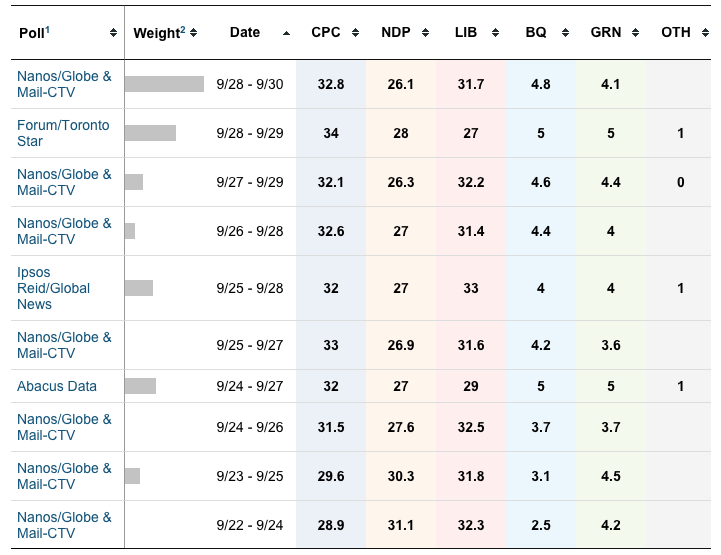
The charts below are from Nanos’ interactive data portal (unless otherwise stated) and each chart represents the last 30-days of polling.

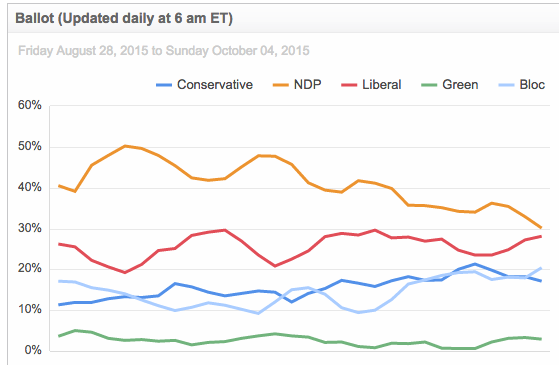
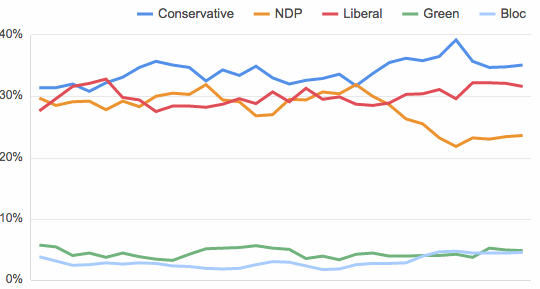
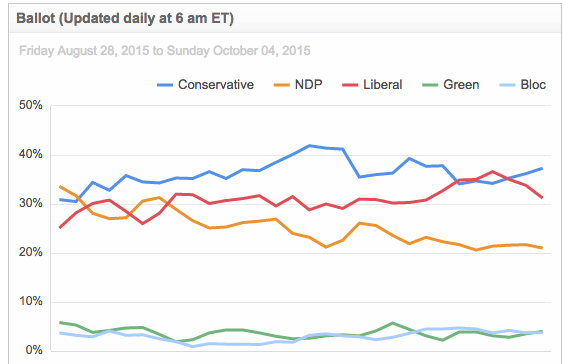
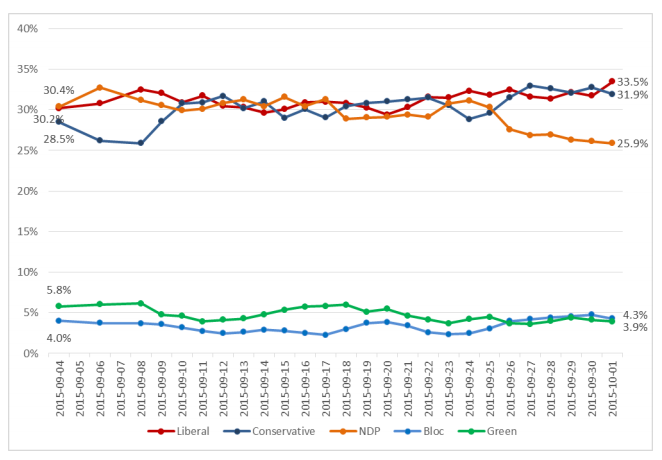
1.  National Race – Liberals winning the Anti-Harper Primary

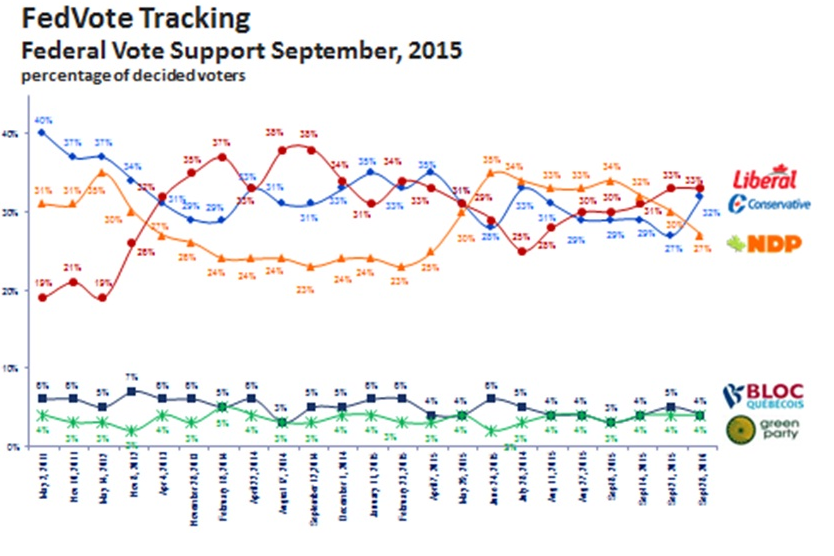
The story of the past week has been that the Liberals are winning the Anti-Harper primary- they are winning the battle as to which opposition party has the best chance of unseating the Conservatives.

Nanos 30 waves national

The Liberal and NDP votes begun to diverge around September 25, when Nanos reported results at 32% Liberal and 30% NDP.  Now, it is 36% Liberal and 23% NDP.  That’s an 11-point difference in a week.

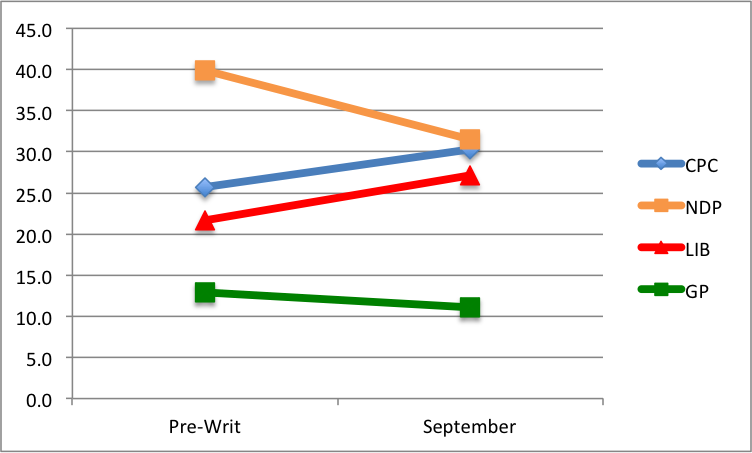
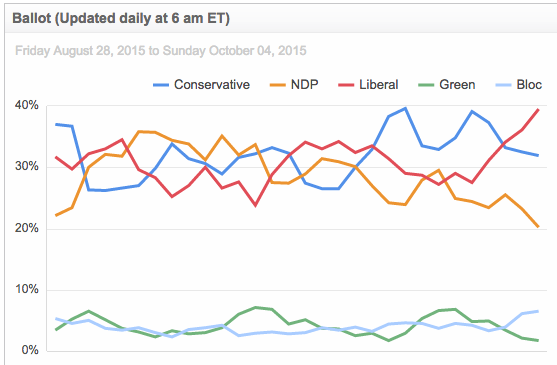
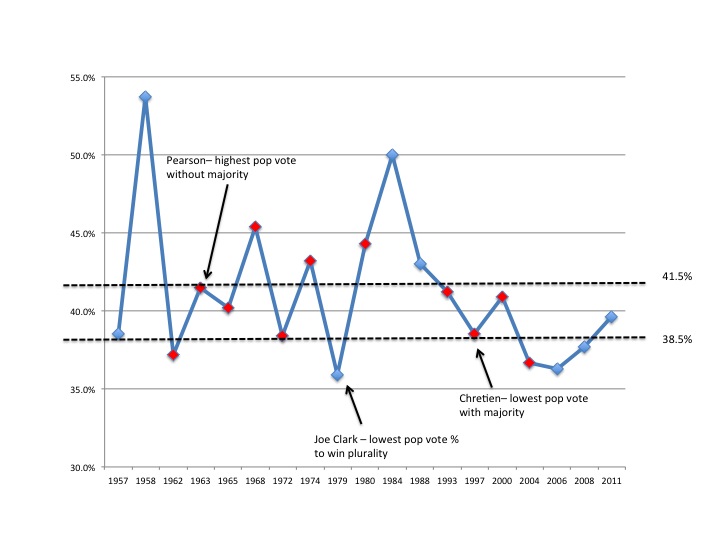
Take a look at the 2011 election:

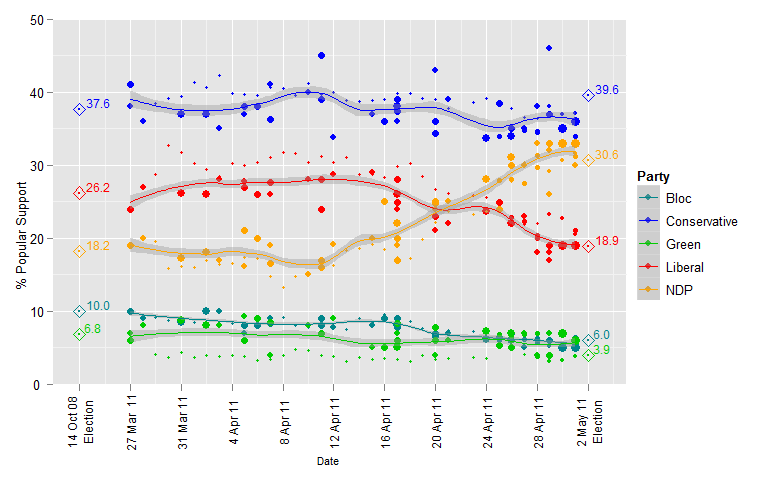
This graph, borrowed from Wikipedia’s 2011 federal election write-up, shows a similar phenomena where the two parties diverged, but that time it was the NDP on the rise and the Ignatieff Liberals in free-fall.  That divergence started about 16 days before Election Day.

      2.  The Regions – Fortress NDP is under attack, Binary race in Ontario

The NDP’s flagging national numbers derive in part from their deterioration in Quebec.  The story here is 10-point drop since September 25th, and a fall of 20 points since September 9th.  The Liberals are posed to gain seats by simply holding ground, while the Bloc have doubled their vote since September 25th.  With 59 of 75 seats in 2011, the NDP is counting on repeating its success and, until recently, it looked like it would, until Prime Minister Harper injected the niqab issue into the campaign.

Quebec 30 waves

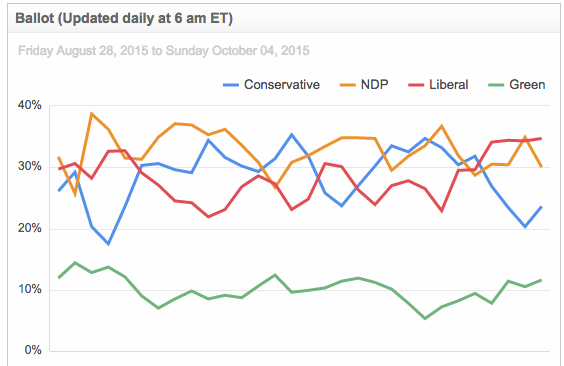
While Quebec sorts itself out, the NDP are many lengths behind in Ontario:

Ontario 30 waves

Where 7 points separated the Liberals and NDP on September 25th, the gap is now 22 points (41 to 19).  This is a two-race in Ontario between the Liberals and Conservatives, with Liberal hopes of gaining the keys to 24 Sussex contingent upon pulling away and racking up a major seat differential here.

BC continues to be a key battleground.  The BC sample size is smaller and more volatile.  With only 180 interviews, the margin-of-error is plus/minus 7.3%, 19 times out of 20.  The key takeaway is that there is a three-way battle.  My view is that the Conservatives appear low right now and likely have more strength.  If the Liberals hang in to garner 30% on Election Day in BC, then they will score a significant increase in seats, from the two they have today to upwards of 10-12.  When there is so much volatility, outliers can get elected.

BC 30 waves

The Prairies continue to look strong for the Conservatives; the Atlantic very strong for the Liberals.  The dynamism of the race is in the three largest provinces.

    3.   Women going Red, Men going Blue, Orange going nowhere

Since September 25th, the Liberals have been gaining among women at the expense of the NDP, doubling their lead over the NDP from 9 points to 18 points.  This trend started a week earlier after relative a period of parity between the parties.

Female 30 waves

Nanos’ numbers indicate that men have been leaving the NDP, bumping up Conservative numbers somewhat.  Whether that is a move directly from Orange to Blue, or a bumping effect involving the Liberals and Bloc is hard to say.  The Conservatives had a 4-point edge over the NDP among men on September 25th and are now at 11-points.

Male 30 waves

     4.  Red-Blue fight among 50 plus voters

I’m less bullish looking at age groups because of sample sizes, but we’ll take a look at the two oldest cohorts.

50-59 year old voters show a decided divergence between Liberal and NDP.  We’ll see if this holds up or if it’s an anomaly.  Given high turnout of plus 50 voters, this is significant.

50 to 59 30 waves

And with 60 plus voters, the Conservatives are on top while the NDP are far behind.

60 plus Nanos 30 waves

And now the caveats

That’s a lot to hang on one pollster’s work.  Doubtlessly, other opinions will come forward this week.  Only Nanos shows a 5 point Liberal lead and Nanos is only pollster who has reported from the weekend (by the way, weekend results can be a little flakey sometimes, in my opinion).  Innovative and Leger showed Liberal leads of two points last week, while Angus Reid Institute and Forum showed clear Conservative leads last week.  Different pollsters, different methodologies (Innovative – online, ARI – online; Forum – IVR).

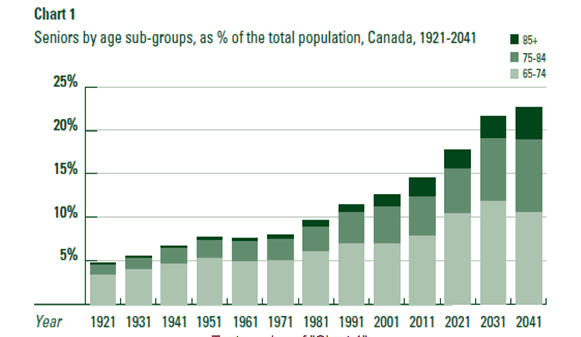
Then there is turnout.  That the Liberals are performing well in the polls among 50 plus voters is significant.   Turnout increases significantly with age, peaking in the 65-74 year old age group.  (See my post on The Grey March).  Liberal strength vis a vis the Conservatives in the 50-59 age group is a bit surprising and is a category to watch.

I have also raised the possibility of sample skew given that a proportion of respondents simply won’t say who they will vote for.  They could be weighted toward one party, against the grain of the overall results.

This election is far from over.  Disruption could occur over the Trans Pacific Partnership or any other issue that comes along.  But this is a critical week for a couple of reasons:

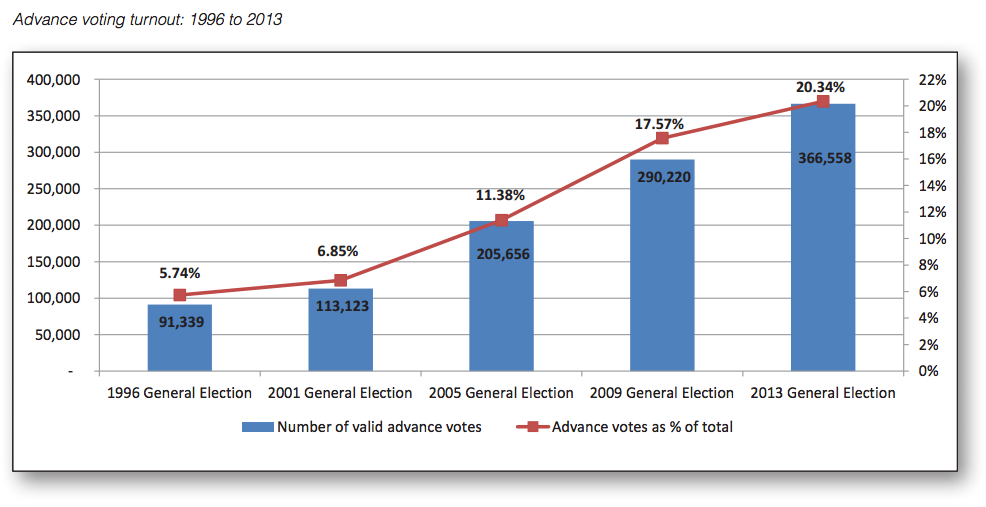
  • Advance voting starts October 9th.  Possibly one-fifth of all votes will be in the box by Thanksgiving Monday.  The parties that are trending up this week will lock in positive results.
  • Thanksgiving interregnum.  Families are getting together this long weekend where politics may be on the menu.  Decisions can be made that will be hard to change in the final week.

The Nanos results speak to a major challenge for the NDP.  They will need to rally their own troops while winning back market share.  The inevitable grumbling by party activists is likely happening as they watch the daily seepage of their poll numbers.  So far, they are keeping a lid on dissent.  A lot can change in 24-hours and they need to find an issue that turns the momentum on its head … or hope for a Liberal and/or Conservative gaffe.

The Liberal concern would be that they are peaking and cannot sustain the growth.  Justin’s performance on the campaign trail has been lauded, benefiting from the low expectations his rivals created for him.  He needs to beat the stuffing out of the NDP heading into Thanksgiving weekend, so to speak, and set up the definitive Red-Blue showdown next week.

Harper is not in a bad place.  Ontario is competitive, they may gain ground in Quebec, and may still recover most of their seats in BC.  They need to pull away with older voters.  What they cannot control are NDP voters deciding to flee to the Liberals to stop them.

Orange is the new Third

Three polls are setting a new campaign narrative that Orange is the new Third in the federal race.  The NDP, say Nanos, IPSOS, and Leger, are slipping back in the race.

My recent post on polling by Innovative Research Group discussed the “Liberal-NDP primary” taking place with a high number of supporters of each party open to changing their mind.  The Liberals are pulling ahead in this primary at a critical stage of the campaign.

Nanos – 7 consecutive days of downward tracking for the NDP opening an 8 pt gap with Liberals.

Screen Shot 2015-10-02 at 7.40.57 AM

IPSOS – From first to third in a week

Screen Shot 2015-10-02 at 7.42.42 AM

Leger – down 3 nationally and a 4-way race in Quebec with NDP down to 28%.  NDP trailing among both francophones (to the Bloc) and among non-francophones (to the Liberals).

Screen Shot 2015-10-02 at 7.40.05 AM

The NDP may take comfort that the Angus Reid Institute has the NDP and Liberals tied, but both looking up at 7 point deficit with the Conservatives.  And in that case, the NDP shed ten points from August to September while the Liberals are up 3 points and the Conservatives up 4 points.

Screen Shot 2015-10-02 at 8.04.53 AM

What now?

The NDP and Liberals are running ads attacking each other.  The NDP are trying to stay alive; the Liberals are trying to finish off the NDP .  The Conservatives are reclaiming voters from both.  But if the primary is settled, and the Liberals pull away, there will be a two-way race down the homestretch.  Justin can win if the NDP collapses and Orange voters in Metro Vancouver , Ontario and Quebec move over to the Liberals.

What happened?

The NDP have been flat-footed.  They fell into the trap of running a front-runner campaign believing that the Liberals were finished.  Instead, Justin’s audacious move to outflank the NDP on deficits shook up the race.  The Syria migrant issue did not hurt the Conservatives as some might have thought.  Instead, the niqab has turned politics on its head in Quebec putting great pressure on Thomas Mulcair.

Perhaps the ultimate story of this campaign will be the “not ready” advertising.  Deemed as brutally effective in July and August, the ads also set a frame of low expectations which Justin has readily exceeded.  Now, in the home stretch, Canadians will look at Justin and determine if he is in fact ready.  The Conservative ballot question, which the NDP bought into, may rebound back on both of them.  Many pundits mocked the Liberals for taking the ballot question head-on, but it may end up working.

There are still 17 days left in this campaign, but only 7 days before Thanksgiving weekend when families talk politics over turkey.  Like ‘moving day at the Masters’, this is the time that the final pairing will be decided, and it is shaping up to be an epic battle.


The Over/Under for Minority and Majority Governments

We all know that it’s seats that matter, not the popular vote.  Ask Joe Clark.  He lost the popular vote by almost five points and became prime minister of Canada.  Or Glen Clark – lost by three points but continued on as premier of British Columbia.

What is the threshold for winning a minority or a majority?

In the past 50 years, the magic number has been a minimum of 38.5% for a majority and a minimum of 35.9% for a minority.  The highest popular vote not to win a majority was 41.5%, therefore, the modern-day range has been 38.5% to qualify for a majority and over 41.5% to be free and clear of a minority.

Chart: Popular vote of party that formed government with plurality of seats

Slide1

In fact, only Pearson was unlucky enough to be above the 38.5% mark and not win a majority -and in two successive elections.  Diefenbaker was on the 38.5% line in 1957 and missed out on a majority that time.  Epic struggles in the Dief-Pearson years.

Here are the majorities – Chretien with lowest popular vote at 38.5% in past 50 years to win a majority:

Majorities PM Vote
1958 Dief 53.7%
1968 PET 45.4%
1974 PET 43.2%
1980 PET 44.3%
1984 Mulroney 50.0%
1988 Mulroney 43.0%
1993 JC 41.2%
1997 JC 38.5%
2000 JC 40.9%
2011 Harper 39.6%

And here are the minorities – Joe Clark with lowest popular vote to win a plurality of seats (35.9%) and Pearson with the highest not to form a majority (41.5%):

Minorities PM Vote
1957 Dief 38.5%
1962 Dief 37.2%
1963 Pearson 41.5%
1965 Pearson 40.2%
1972 PET 38.4%
1979 Joe 35.9%
2004 Martin 36.7%
2006 Harper 36.3%
2008 Harper 37.7%

Many winning parties have had great vote efficiency, such as Joe in 1979 or Chretien in three successive elections where he owned almost every seat in Ontario.

In this three-way fight, it seems very likely that the winning party will have less than 38.5%, with history telling us that that would yield a minority government.  A quick look at public polls on the CBC polltracker site shows that the parties are still a ways away – if you take the polls literally.

Screen Shot 2015-10-01 at 8.20.32 AM

Enter Ontario.  The Bob Rae government scored 57% of the seats with 37.6% of the vote in 1990; the Dalton McGuinty government took 50% of the seats with 37.7% of the vote in 2011.  It may not take 38.5% for a majority this time – who knows what crazy things might happen, especially when there is a huge distortion in the population of individual ridings across the country.

Until we see polls showing a party crossing 35%, it looks like Pizza Parliament.  North of 35% in the polls, then the likelihood of a majority government increases.

The Grey March

Canada’s legion of Grey voters are growing and are a bigger slice of the pie with each passing election.  We saw in the Lower Mainland transit referendum that voting is a contact sport for grandma and grandpa.

Screen Shot 2015-09-30 at 8.43.05 AM

Two polls released earlier this week show that a Grey March may be afoot.

Abacus:

60 years plus:

  • 41% CPC
  • 26% NDP
  • 24% LIB

IPSOS:

55 years plus:

  • 41% CPC
  • 26% LIB
  • 25% NDP

In both cases, older voters are returning to the Conservatives.  We all know old people vote at a higher rate, so … election in the bag?  Not so fast.

The Abacus poll shows the Liberals neck and neck with the Conservatives in the 30-59 age group (NDP close behind), while IPSOS shows a considerable Liberal lead in the 35-54 group.

IPSOS has the Conservatives lagging in the 18-34s (which rings true) while Abacus has a 3-way split in the 18-29s (that would be surprising).

Where were seniors and soon-to-be seniors a few weeks ago?

Among 60 plus, Abacus found a 7 pt Conservative lead over the Liberals between September 9th -11th; they’ve stretched that lead to 15 points over NDP and 17 points over the Liberals.

IPSOS had the Conservatives and NDP tied among 55+ (33% each) between September 4th -8th.  Now it’s a 16 pt Conservative lead.  That’s a huge swing.

Part of the story of the BC election surprise was the underlying turnout advantage of the BC Liberals.  The age demographic numbers seem familiar in this election except that it’s a three-way fight and the Conservatives do not have enough of a lead among older voters to compensate for weakness among younger voters.

Looking at the Abacus data, and crunching it against the overall number of voters in each age group multiplied by Elections Canada turnout estimates by age group, I find that the Conservatives have an extra bump of 1.5%, pushing them to 33.5% from 32%.  Compared to a few weeks ago, the Conservative war room is probably feeling pretty good about things.   Better not get too cocky about it though.  This race is still very competitive and they haven’t reached Joe Clark territory yet (35.9%).

To win, the Liberals and the NDP need to slow down the Grey March.  These Freedom 55 voters have a turnout rate of around 70%.

Let’s climb down from this scenario and exhale.  Nineteen days is a lot of time in a campaign and we have seen what the last nineteen days have done to the NDP.  Anything can happen and there are things opposition parties can do to divert the march.  Moreover, this analysis is putting a lot of stock into two polls – there are countless others.

Looking ahead, three dynamics on the Grey March:

  1. At 41% among the Grey, the Conservatives are still well below the level of support they had in the last election among this group.  Arresting Conservative growth will thwart their ability to have a decisive win.  Turning it back, will result in a change in government.
  2. What’s the message for seniors?  The Conservatives are dropping messages into this category with precision and it appears to be working.   Opposition advertising will need to be revisited.  Will Justin be able to polarize the debate to drive NDP seniors over to Liberal? Or is at matter of Justin appealing to small ‘l’ liberal seniors who are parking with the Conservatives until they decide on Justin’s readiness?  The NDP have had a stronger appeal with seniors leading into the election than the Liberals but are seeing it ebb away.  Seniors remain consumers of newspapers and TV news – wooing them is not a social media campaign.
  3. In so much as there is a generational advantage with younger voters, effective turnout strategies will be critical.  In other words, if you are going to lose with seniors, you better turn out younger voters.  A very hard thing to do and, in the context of limited resources, arguably yields a poor return.  It would be better to just not lose with seniors!

Did I say there were 19 days left in the campaign?  Oops.  An increasing amount of voters are utilizing advance polls, with seniors being the keenest to vote early.  This election will be over for many voters well before the 19th.

Keep an eye on the Grey March.  The age breaks in these surveys should be focusing the minds of all campaigns and serve as a wake-up call to opposition parties about where this election could be headed.  They’ve fallen … but they still have time to get up.

Power Point Polling Palooza with Professor Greg Lyle

I started off the week with a Monday am breakfast presentation of poll numbers from Greg Lyle of Innovative Research Group.  No doubt, all Canadians will be dining out on poll numbers for the next three weeks.  We’ll be stuffed like Thanksgiving turkey.

I worked with Greg on two occasions: with the BC Liberals from 1994-1996 where we triumphed by winning the popular vote, and from 2005-2010 when I was an associate with Innovative.  As I have grown accustomed, Greg – or ‘Professor Lyle’ if you will – came loaded with a blizzard of line graphs, stacked columns, and pie charts.  It was Power Point Palooza.  Political geeks like me go to these breakfasts instead of Burning Man.

You can’t walk down the street without running into a pollster these days.  But few pollsters dig into the numbers like Greg and share those insights with the public. Sure, you can get some version of the horserace on your next newscast, but Greg is asking – as the horses are in the 5th of 8 furlongs – what are the track conditions?  What are they feeding the horses?  What is the performance of the jockey?  Does the horse have the stamina to finish?  Should the horse be sent to the glue factory?  I’ve had a lot of ‘winning bets’ in the fifth furlong only to see my horse fade down the stretch.  Greg is focused on why the voters are responding the way they do.  That’s interesting stuff.

Here are three slides from his presentation and why they matter:

  1.  The Liberal – NDP Primary

Is this a general election yet, or just a primary between the Liberals and the NDP as to which will be in the runoff with the Conservatives?  Greg asks who’s made up their mind versus who would like to hear more.

Mind made up

Only 26% of Conservatives would like to hear more while 42% of Liberals and 43% of NDP are open, not to mention 44% of the Bloc and 50% of the Greens.  As a succession of recent polls show (Nanos, Abacus, Innovative), the NDP are struggling to stay with the Liberals, in part because they are shedding support in Quebec and slipping behind in Ontario.  The key to 24 Sussex Drive for either Justin Trudeau or Thomas Mulcair is to win the primary and the research shows minds are still open.  However, it’s not a closed primary.  Some of those votes are open to the Conservatives too.

             2.  The shifting support among values clusters

Greg’s research shows party support by values clusters measured on a two-dimensional scale: by left-right axis and a populism axis.  Populism is measured (my colloquial explanation) by whether one defers to experts or one puts more stock in the common sense of regular people.  You might say it’s Starbucks vs. Tim Horton’s.

values

What Greg found is that, since July,  the Liberals have been poaching the most support from the NDP among Core Left  and Left Liberals.  Liberals have also gained from the Conservatives among Business Liberals (centrist, non-populist – think Paul Martin) while the Conservatives have gained support from Liberals among Deferential Conservatives (conservative, non-populist – think Joe Clark).

Here are the numbers for these clusters:

Cluster July NDP Sept NDP July LIB Sept LIB July CPC Sept CPC
Core Left 59% 41% 28% 35% 3% 6%
Left Liberals 38% 27% 29% 40% 14% 16%
Business Liberals 23% 21% 30% 37% 30% 26%
Deferential Conservatives 16% 15% 22% 15% 52% 58%

Thus, you have some voters returning to natural homes, but you also have some lefties migrating to the Liberals too.

Interestingly, it is the non-populist voters that are the most volatile, according to Greg’s research, while the populist voters have not moved as much.    I expected the opposite to be true, but an explanation may be that populists have decided and moved on and “the Starbucks crowd” are debating their vote before they make it.

With regard to the ‘primary’ discussed in my first point, there is movement among NDP and Liberal voters, but there is a flow from Liberal and NDP to Conservative too.  The Conservative growth potential is not very high, but they only need a few points to make a huge difference.  One populist cluster that did show some movement was Populist Conservatives which saw a swing of 7-8 points from the NDP to the Conservatives (think Vancouver Island loggers or Kootenay miners as an example of a Populist Conservative).

See the full value clusters deck which includes how each values cluster is constructed and defined.

             3.  The Consistent versus the Ambivalent

I am highly interested in who is actually going to vote.  As I posted recently on the Lower Mainland transit plebiscite, there is usually a strong age correlation that peaks in the 65-74 age group.  Greg’s research offers an insightful analysis based on consistency versus ambivalence.

Essentially, he has analyzed the answers of individual respondents within the survey and categorized people based on who is consistent on responses, who is conflicted, and to what degree they are wishy-washy (eg. respond ‘don’t know’ to a lot of questions, undecided on vote).

Ambivalence


About a quarter of those polled are perfectly consistent and likely have a plan to vote.  About 13% are, well, out-to-lunch and will likely not vote (in my opinion).  That leaves about 60% of voters who are on a continuum of mainly consistent to mainly ambivalent, and within that continuum, they are the ones that are more likely to say they would like to hear more.

Ambiv 2

In the consistent-conflicted range, “would like to hear more” ranges from 45%-65%.  This reflects a lot of the Lib-NDP switchers.

But my starting point on this topic is who is going to vote?  Perhaps Greg will show these consistency segments by vote as whoever has the most ‘consistent’ supporters compared to ‘ambivalent’ supporters will have a turnout advantage.

In any event, analyzing survey responses to design such a segmentation is pretty cool.


In conclusion, a lot of polling is being digested in this election.  It’s good to see work that goes deep and is publicly available.  This is different than what political parties are likely doing internally, but if you’re in the peanut gallery, and you’re watching a horserace, then you can dig into it while mixing your metaphors, and see how it all turns out on October 19th.


Election turnout: Will cranky old “won’t says” deliver an October surprise?

Cranky old geezers.  You know who I’m talking about.  They get a phone call at dinner time and damn well won’t say how they voted – “Won’t says”.

In a live telephone survey (humans talking to humans), there is always a percentage of respondents that will take the survey, but won’t play ball on the political questions.  Partly it’s a matter of principle that it’s a secret ballot and their own business, no one else’s.  Partly they got up on the wrong side of the bed.

My review of some recent telephone surveys indicates about 6% or 7% of respondents will refuse to answer the ballot question.  When I looked further, it was disproportionately older voters who refused, and in one survey, they expressed a high likelihood to vote relative to other respondents.

Thus, that 6% to 7% of refusals might actually represent 8% or 9% of the electorate – the people who actually vote.

(Nanos Research is doing live telephone tracking but it is not releasing its cross tabs or won’t says)

Won’t says don’t really appear that much in online surveys because people that belong to online panels want to share their opinions proactively.

My assumption regarding automated IVR surveys is that those not wishing to play ball with the survey hang up and the refusal is not recorded in the topline.

Based on the live telephone surveys we at least now that, say, 1 in 12 voters are uncooperative in sharing their opinion so that creates the potential for a skew of results.  Not a huge skew, but a bit of a skew.

Let’s say Party X has 30% support in the polls and that’s actually how it plays out.  The 92% of cooperative sample brings 30% of 92% to the voting stations  Then let’s say Party X has 45% support among the 8% of won’t say voters.  Combine that and their vote rises from 30% to 31.2%.  Meanwhile, Party Y also gets 30% among the 92%, if you follow.  But in the 8% won’t say pool, Party Y only yields 20%.  Their overall result drops from 30% to 29.2%.

 (92% of voters) Cooperators % of votes cast
Party X 30.0% 27.6%
Party Y 30.0% 27.6%
 (8% of voters) Won’t Says % of votes cast
Party X 45.0% 3.6%
Party Y 20.0% 1.6%
Final total Change
Party X 31.2% plus 1.2%
Party Y 29.2% minus 0.8%

Therefore, if the won’t says break hard to one party, in this scenario they would cause a two-point differential in the polls, which would be very significant in a close race.  The support was always there, it was just under-reported.

There are other factors that make it difficult to transfer polling results to election returns, which I will write about later, but the issue of won’t says is one that there isn’t a lot of discussion about and may contribute, in part, why we see election night surprises.

Those cranky old won’t says do deliver an important message – they’ll vote any way they please, pollsters be damned.

What happened to the NDP vote?

The persistent media narrative has been that the NDP have a big lead in BC in #elxn42.  Or do they?

Nanos tracking has show a decided downward trend for the NDP in the past two weeks.  While it is has now appeared to stabilize – they were third at one point – they are no higher than the Conservatives.  If the polling is accurate, it’s not great news either for the Conservatives who are far below their 2011 mark but better than the pre-writ.  It’s a lot better news for the Liberals who have bounced back from a lousy spring-summer.

Last week’s release of polling data by the Dogwood Initiative is interesting on two counts.  First, the numbers in and of themselves show that in seven ridings, the NDP vote was down across the board.  The average decline in NDP vote from pre-writ to September was -8.4% of the decided vote per riding.  Conservatives up an average of 4.6% and Liberals 5.5%.  That’s a 14 point swing between NDP and Liberals and 13 for NDP/Conservative.  While the earlier Dogwood polling was trumpeted by the left-wing organs, not much heard on this round.

This not-too fancy graph shows the results across seven “battleground” ridings tested by Dogwood and Insights West: three on the North Shore (West Van, North Van, Burnaby-NV Seymour), South Okanagan-West Kootenay, Vancouver South and two on the Island (Courtenay-Alberni and Esquimalt-Saanich-Sooke).

Dogwood polls

In the weeds, here are the swings in decided vote per riding.  That’s a pretty big swing in Burnaby-North Van Seymour, changing the story from a 27 point NDP lead in May to a four-point lead in September.

CPC/NDP swing LIB/NDP swing
West Van – SC – Sea to Sky(J) -4.6 -7.0
North Vancouver(J) -11.4 -20.3
Burnaby-NV Seymour(M) -22.7 -22.9
Vancouver South(J) -11.5 -9.5
South Okanagan-W.Kootenay(J) -20.9 -19.5
Courtenay-Alberni(M) -5.1 -1.9
Esquimalt-Saanich-Sooke(M) -15.1 -16.3

This is more interesting if you take the polling literally, and I don’t.  I don’t think the first round of polling was realistic.  They had the Liberals at 6% in Burnaby-North Van Seymour.  Give me a break.  However, given that some media reported these numbers on the first go-around, they are obligated to give the second round some attention as well, and if they do, they must show that the NDP have fallen from great heights.  The Notley-Alberta win halo effect is wearing off.

Which brings me to my second point.  Why is Dogwood doing this in the first place?  They are presumably doing this to encourage strategic voting.  Well, the results show that the Liberals are rivalling the Conservatives in areas where Liberals have won seats before, and NDP are doing well in other seats where they are traditionally stronger.  Surprise, surprise.  Is this polling necessary?

The party that is not being helped by Dogwood on any of this is the Greens, the party that truly supports Dogwood’s anti-pipeline stance.  After all, the NDP position on Kinder Morgan is nuanced, to say the least.  The Notley government in Alberta will go full-out to lobby a federal NDP government to approve a pipeline to the west coast.  But the Greens have been written off by the strategic voting advocates using the logic of don’t vote for who you want, vote for who has best chance to beat Harper.  Elizabeth May would not have polled very strongly five weeks out in 2011 either but she won.   How about letting people make up their own mind – they will anyway – and they often do so in pundit/pollster-defying ways.

If I were in the war room for the NDP or Liberals, I would want to tell Dogwood to take a hike with their polling.  I would want to duke it out on my own terms.  If I were in the Green war room (if they have one), I would be thinking “with friends like these, who needs enemies”.