We all know that it’s seats that matter, not the popular vote. Ask Joe Clark. He lost the popular vote by almost five points and became prime minister of Canada. Or Glen Clark – lost by three points but continued on as premier of British Columbia.
What is the threshold for winning a minority or a majority?
In the past 50 years, the magic number has been a minimum of 38.5% for a majority and a minimum of 35.9% for a minority. The highest popular vote not to win a majority was 41.5%, therefore, the modern-day range has been 38.5% to qualify for a majority and over 41.5% to be free and clear of a minority.
Chart: Popular vote of party that formed government with plurality of seats
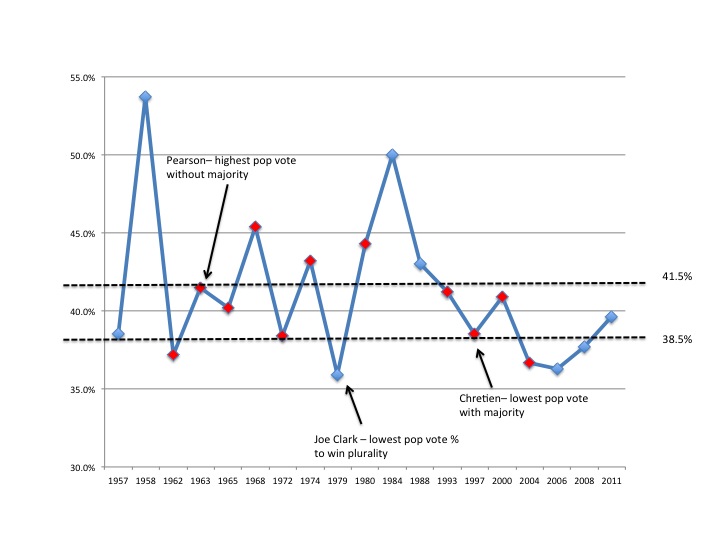
In fact, only Pearson was unlucky enough to be above the 38.5% mark and not win a majority -and in two successive elections. Diefenbaker was on the 38.5% line in 1957 and missed out on a majority that time. Epic struggles in the Dief-Pearson years.
Here are the majorities – Chretien with lowest popular vote at 38.5% in past 50 years to win a majority:
| Majorities | PM | Vote |
| 1958 | Dief | 53.7% |
| 1968 | PET | 45.4% |
| 1974 | PET | 43.2% |
| 1980 | PET | 44.3% |
| 1984 | Mulroney | 50.0% |
| 1988 | Mulroney | 43.0% |
| 1993 | JC | 41.2% |
| 1997 | JC | 38.5% |
| 2000 | JC | 40.9% |
| 2011 | Harper | 39.6% |
And here are the minorities – Joe Clark with lowest popular vote to win a plurality of seats (35.9%) and Pearson with the highest not to form a majority (41.5%):
| Minorities | PM | Vote |
| 1957 | Dief | 38.5% |
| 1962 | Dief | 37.2% |
| 1963 | Pearson | 41.5% |
| 1965 | Pearson | 40.2% |
| 1972 | PET | 38.4% |
| 1979 | Joe | 35.9% |
| 2004 | Martin | 36.7% |
| 2006 | Harper | 36.3% |
| 2008 | Harper | 37.7% |
Many winning parties have had great vote efficiency, such as Joe in 1979 or Chretien in three successive elections where he owned almost every seat in Ontario.
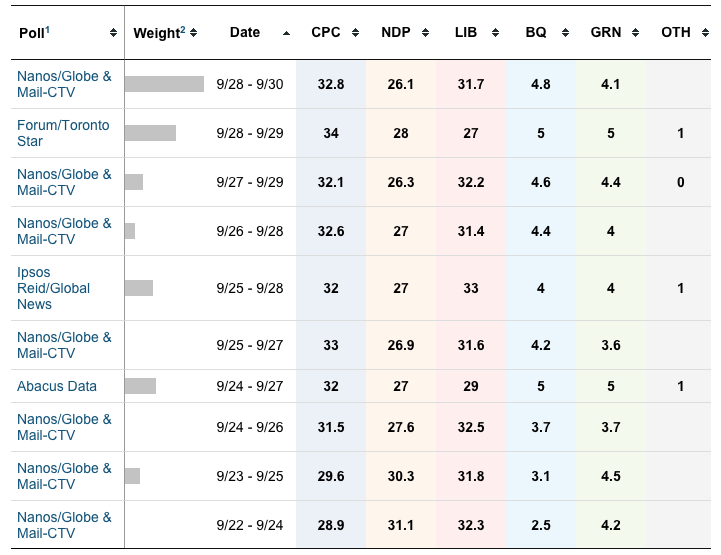
In this three-way fight, it seems very likely that the winning party will have less than 38.5%, with history telling us that that would yield a minority government. A quick look at public polls on the CBC polltracker site shows that the parties are still a ways away – if you take the polls literally.
Enter Ontario. The Bob Rae government scored 57% of the seats with 37.6% of the vote in 1990; the Dalton McGuinty government took 50% of the seats with 37.7% of the vote in 2011. It may not take 38.5% for a majority this time – who knows what crazy things might happen, especially when there is a huge distortion in the population of individual ridings across the country.
Until we see polls showing a party crossing 35%, it looks like Pizza Parliament. North of 35% in the polls, then the likelihood of a majority government increases.
