Election turnout: Will cranky old “won’t says” deliver an October surprise?

Cranky old geezers.  You know who I’m talking about.  They get a phone call at dinner time and damn well won’t say how they voted – “Won’t says”.

In a live telephone survey (humans talking to humans), there is always a percentage of respondents that will take the survey, but won’t play ball on the political questions.  Partly it’s a matter of principle that it’s a secret ballot and their own business, no one else’s.  Partly they got up on the wrong side of the bed.

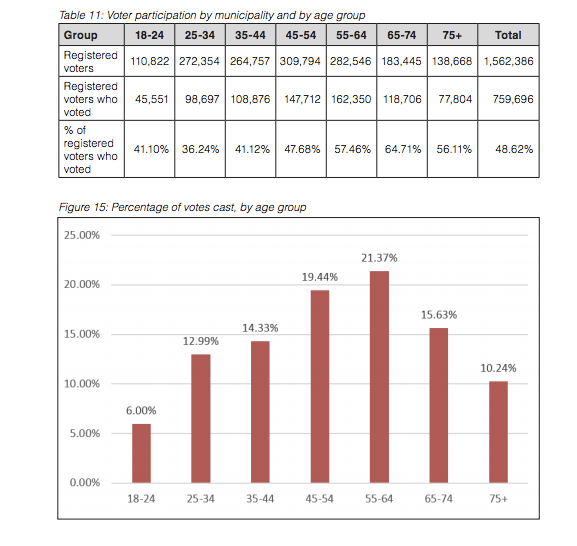
My review of some recent telephone surveys indicates about 6% or 7% of respondents will refuse to answer the ballot question.  When I looked further, it was disproportionately older voters who refused, and in one survey, they expressed a high likelihood to vote relative to other respondents.

Thus, that 6% to 7% of refusals might actually represent 8% or 9% of the electorate – the people who actually vote.

(Nanos Research is doing live telephone tracking but it is not releasing its cross tabs or won’t says)

Won’t says don’t really appear that much in online surveys because people that belong to online panels want to share their opinions proactively.

My assumption regarding automated IVR surveys is that those not wishing to play ball with the survey hang up and the refusal is not recorded in the topline.

Based on the live telephone surveys we at least now that, say, 1 in 12 voters are uncooperative in sharing their opinion so that creates the potential for a skew of results.  Not a huge skew, but a bit of a skew.

Let’s say Party X has 30% support in the polls and that’s actually how it plays out.  The 92% of cooperative sample brings 30% of 92% to the voting stations  Then let’s say Party X has 45% support among the 8% of won’t say voters.  Combine that and their vote rises from 30% to 31.2%.  Meanwhile, Party Y also gets 30% among the 92%, if you follow.  But in the 8% won’t say pool, Party Y only yields 20%.  Their overall result drops from 30% to 29.2%.

 (92% of voters) Cooperators % of votes cast
Party X 30.0% 27.6%
Party Y 30.0% 27.6%
 (8% of voters) Won’t Says % of votes cast
Party X 45.0% 3.6%
Party Y 20.0% 1.6%
Final total Change
Party X 31.2% plus 1.2%
Party Y 29.2% minus 0.8%

Therefore, if the won’t says break hard to one party, in this scenario they would cause a two-point differential in the polls, which would be very significant in a close race.  The support was always there, it was just under-reported.

There are other factors that make it difficult to transfer polling results to election returns, which I will write about later, but the issue of won’t says is one that there isn’t a lot of discussion about and may contribute, in part, why we see election night surprises.

Those cranky old won’t says do deliver an important message – they’ll vote any way they please, pollsters be damned.

Over 50% shades of grey in Transit vote turnout

Elections BC released voting information from the transit referendum, er, plebiscite.

The published turnout rate ranges from a low of 36.24% among 25-34 year olds to 64.71% among 65-74 year olds.  This is consistent with the 2013 provincial election in terms of older people voting at a higher rate than younger people.

Why are 18-24s voting at a higher rate than 25-34s?  They’re not.  Turnout rate is based on % of registered voters but fewer 18-24s are registered to vote.  Base it on actual population and you will see a lower number.  Turnout typically peaks at 65-74 age then declines post 75, though still high relative to under 50 crowd.

Screen Shot 2015-09-22 at 4.15.26 PM

It’s interesting to see the share of voters from each age group – this is more important.  Over 47% of the transit vote was over age of 55.  They are punching above their census weight while the opposite is true of younger voters.  About one-third of voters were under age of 44.

Bear this in mind when reading the polls.  Parties or candidates with high support in 18-34s may not sustain that support on Election Day while parties with strong support among plus 55s can surprise.  Where have I heard that before?

What happened to the NDP vote?

The persistent media narrative has been that the NDP have a big lead in BC in #elxn42.  Or do they?

Nanos tracking has show a decided downward trend for the NDP in the past two weeks.  While it is has now appeared to stabilize – they were third at one point – they are no higher than the Conservatives.  If the polling is accurate, it’s not great news either for the Conservatives who are far below their 2011 mark but better than the pre-writ.  It’s a lot better news for the Liberals who have bounced back from a lousy spring-summer.

Last week’s release of polling data by the Dogwood Initiative is interesting on two counts.  First, the numbers in and of themselves show that in seven ridings, the NDP vote was down across the board.  The average decline in NDP vote from pre-writ to September was -8.4% of the decided vote per riding.  Conservatives up an average of 4.6% and Liberals 5.5%.  That’s a 14 point swing between NDP and Liberals and 13 for NDP/Conservative.  While the earlier Dogwood polling was trumpeted by the left-wing organs, not much heard on this round.

This not-too fancy graph shows the results across seven “battleground” ridings tested by Dogwood and Insights West: three on the North Shore (West Van, North Van, Burnaby-NV Seymour), South Okanagan-West Kootenay, Vancouver South and two on the Island (Courtenay-Alberni and Esquimalt-Saanich-Sooke).

Dogwood polls

In the weeds, here are the swings in decided vote per riding.  That’s a pretty big swing in Burnaby-North Van Seymour, changing the story from a 27 point NDP lead in May to a four-point lead in September.

CPC/NDP swing LIB/NDP swing
West Van – SC – Sea to Sky(J) -4.6 -7.0
North Vancouver(J) -11.4 -20.3
Burnaby-NV Seymour(M) -22.7 -22.9
Vancouver South(J) -11.5 -9.5
South Okanagan-W.Kootenay(J) -20.9 -19.5
Courtenay-Alberni(M) -5.1 -1.9
Esquimalt-Saanich-Sooke(M) -15.1 -16.3

This is more interesting if you take the polling literally, and I don’t.  I don’t think the first round of polling was realistic.  They had the Liberals at 6% in Burnaby-North Van Seymour.  Give me a break.  However, given that some media reported these numbers on the first go-around, they are obligated to give the second round some attention as well, and if they do, they must show that the NDP have fallen from great heights.  The Notley-Alberta win halo effect is wearing off.

Which brings me to my second point.  Why is Dogwood doing this in the first place?  They are presumably doing this to encourage strategic voting.  Well, the results show that the Liberals are rivalling the Conservatives in areas where Liberals have won seats before, and NDP are doing well in other seats where they are traditionally stronger.  Surprise, surprise.  Is this polling necessary?

The party that is not being helped by Dogwood on any of this is the Greens, the party that truly supports Dogwood’s anti-pipeline stance.  After all, the NDP position on Kinder Morgan is nuanced, to say the least.  The Notley government in Alberta will go full-out to lobby a federal NDP government to approve a pipeline to the west coast.  But the Greens have been written off by the strategic voting advocates using the logic of don’t vote for who you want, vote for who has best chance to beat Harper.  Elizabeth May would not have polled very strongly five weeks out in 2011 either but she won.   How about letting people make up their own mind – they will anyway – and they often do so in pundit/pollster-defying ways.

If I were in the war room for the NDP or Liberals, I would want to tell Dogwood to take a hike with their polling.  I would want to duke it out on my own terms.  If I were in the Green war room (if they have one), I would be thinking “with friends like these, who needs enemies”.

5 things to watch for in #elxn42 polls

I posted a brief Twitter essay tonight on five things to watch for when reading up on election polls. Admittedly, I viewed the work of an unnamed pollster which inspired my essay.

1/ Beware! Here are 5 things to watch for in polls. #1 There is no margin of error for online surveys. They’re not random.

2/ How much are they weighting 18-34 age group and other demos? Without weighted and unweighted numbers, can’t tell.

3/Are they showing the n values for regional breaks? Media are reporting based on some very small sample sizes.

4/ In diverse areas like and Toronto, are they representing Chinese and other significant populations?

5/Are they showing the results from all questions? Eg. If xtab shows how people voted in 2011, show that topline.

My comments led me into an interesting dialogue with Poli Sci Professor Peter Loewen (University of Toronto). We mostly agreed but he fairly points out that online surveys are not as perilous as my tweet suggests while landline telephone surveys have similar challenges.  True enough, but we violently agree on more transparency and openness from pollsters.  (See my Twitter timeline – @bcmikemcd – for this riveting debate but please don’t admit that you did to any friends or family).

Media are hooked on free polls by any pollster who has put together a website.  In some cases, the polls are clearly motivated by a political interest and in virtually all cases, the company is looking for a cost-effective way to promote their business.  All I’m saying is that if you are going to use the free polls, put more scrutiny on the product.  The embarrassments are piling up like cordwood heading into a Yukon winter.

What I do like about the embarrassments though is that voters are still in charge, and they know it.