The BC Liberal leadership election reached an exciting conclusion on February 3rd. Five professional campaigns believed they had a pathway to victory and it was a night where the slightest breeze could have blown the math in another direction.
After gaming out the scenarios about infinity times, I could only come up with a few predictions – Dianne Watts would lead on the first count, Sam Sullivan would be sixth, and the race would go down to the fifth count. What order would the candidates be from two to five? Everyone had an opinion. Of those four caucus contenders jockeying for position, certainly none were volunteering that they were fifth! If there was a prevailing theory about who was fifth, it often mentioned Wilkinson – and that theory wasn’t really wrong. Wilkinson was fifth in terms of raw votes on the first count, but more importantly, third in terms of weighted votes (points), and that’s what matters.

BC Liberal Leader Andrew Wilkinson (CBC.ca)
I only knew one other thing for sure – that I was bound to be surprised. Some candidates would fall short of expectations and some would exceed them. You wouldn’t know until you saw it.
If you are wondering about how the votes get counted in this preferential ballot, regionally-weighted system, see my blog post on how it works.
The only way to look at this is one count at a time.
Table 1: Results by ballot (weighted)
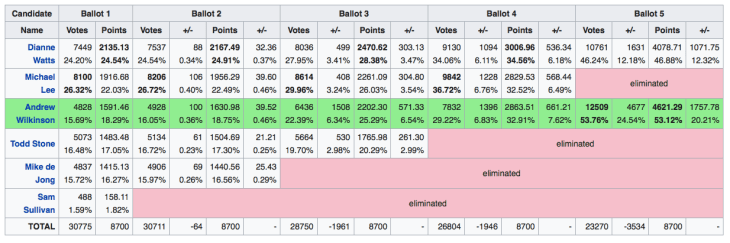
Source: Wikipedia. Note: this graphic was updated. Original contained minor errors.
Count 1
There was a feeling among many members I talked to that Dianne Watts would have a challenge growing her support as the counts progressed. While well-known as Mayor of Surrey and enjoying the outsider mantle, she did not have deep personal connections throughout the province with Party members as Christy Clark had in 2011. It was clear that she would need to start off strong in the high 20s and that there be a gap between her and the second and third place candidates. Her first count result (24.54%) fell short and the gap between her and her rivals too narrow.
Michael Lee’s second place showing on the first count (22.03%) was impressive for a rookie MLA that had just begun to raise his profile in the Party. Lee pulled together a veteran campaign team and a strong group of supporters, with prowess in recruiting new members, particularly in the South Asian and Chinese-Canadian communities. In fact, Lee had the most actual votes of any candidate in the first four counts.
Table 2: Raw votes by Ballot

So, how you can get more votes and less points? Under the regional weighting system, every riding is treated equally. A riding with 800 voting members is worth the same as a riding with 200 voting members. While Lee had the highest number of casted votes, by a margin of more than 600 over Watts, many of them were in ridings with high membership totals. On the other hand, Wilkinson had the fifth highest number of votes on the first count, but because he had strength in ridings with lower membership (eg. rural BC), he finished third in terms of points, which was critical.
Table 3: Vote efficiency (1st count)

The table above shows that every candidate, but Lee, had a higher percentage of points compared to raw votes. This is basically a reflection of Lee’s sign-up success in those high-member ridings. Of the five ridings with the highest number of voters – Surrey Panorama, Abbotsford West, Surrey Newton, Vancouver Quilchena and Surrey Green Timbers – Lee won four and was a strong second in the fifth. He was second in Mike de Jong’s riding (Abbotsford West) which means Lee won Quilchena, Wilkinson’s riding (39% to 33%).
Notwithstanding the points system working against Lee, his second place finish put him in a strong position to win given that Watts was sub-25%.
Watts and Lee shared one trait in common – they were newcomers who did not have a Caucus endorsement between them. They were banking on the Party members wanting to go in a different direction than what was being put forward by the three veteran ex-cabinet ministers in the race.
Those three ex-ministers – Wilkinson, Stone, de Jong – accounted for just about 52% of the points on the first count. Only two percentage points separated third (Wilkinson) from fifth (de Jong).
Wilkinson and de Jong had announced their deWilkinson deal a couple of weeks ago where they recommended each other to their supporters for second choice. It was an ideal scenario for Wilkinson to have placed ahead of de Jong and receive the hoped-for benefits of that deal. Stone, stuck in the middle between Wilkinson and de Jong, could only hope for divine providence once de Jong dropped off the ballot.
Now that we know where everyone stood at the end the first count, where did the points come from?
Table 4: First count by region (weighted vote)

Breaking down the Province into only three regions is a limited form of analysis, but it does show some key storylines.
Watts led the Island, and was second in the Lower Mainland, but slipped to third in the Interior. While there are twice as many ridings in the Lower Mainland than the Interior, the weakness up country slowed down her first count support.
Michael Lee showed a lot of strength in the Lower Mainland, taking 29% of the points, eclipsing Wilkinson and Stone. However, his support was less than half of that on the Island and in the Interior where he is not well known.
For a Vancouver guy, Andrew Wilkinson did not do well on the first count in the Lower Mainland. But he did very well in the Interior. When looking at his support and Stone’s, you can see that the profile of their vote, regionally, was very similar except that Wilkinson did just enough to keep ahead of him.
Wilkinson’s weakness in the Lower Mainland would be mitigated on subsequent counts by second, third, and fourth choices.
Mike de Jong showed well in the Lower Mainland, but could not generate enough support in the regions.
In terms of specific ridings, the table below shows the Top 5 ridings for each of the five main contenders:
Table 5: Top 5 ridings of leadership contenders on 1st count

Watts’ top finishes were close to home, in South Surrey and the adjacent Langleys. Lee drew on strong support in Surrey and Richmond, as well as his own riding in Vancouver. These ridings reflected his sign-up strength. Wilkinson’s top 5 were all in the Interior and were all ridings held by caucus endorsers. Stone dominated his riding of Kamloops-South Thompson (90.3%) and Kamloops North-Thompson (82.3). No other candidate received more than 67% on the first count in any given riding, so Stone’s Kamloops base really delivered. Nearby Shuswap and Fraser Nicola also gave him majority tallies on the first count while North Van Seymour was his best showing in the Lower Mainland. de Jong’s best result was in Peace South. MLA Mike Bernier dropped out of the race early to endorse de Jong. de Jong drew strength from the three Abbotsford ridings though did not gain majorities there.
Overall, what was interesting was how candidates did very well in some ridings and very poorly in others. Wilkinson had 67.8% in Kootenay East but only 1.6% in Abbotsford South. He was below 10% in 25 ridings on the first count. Watts was stronger in more ridings than anyone with only five ridings where she had less than 10%, but she didn’t really crush it in enough ridings. Stone had 31 ridings where he could not garner 10%, and his lowest five ridings were in Richmond, East Van, and Burnaby. de Jong’s lowest five were all in the Interior where Stone and Wilkinson did well. Similarly, Lee’s bottom five were in the Interior.
The ‘lumpiness’ of the voting results demonstrated the opportunity for candidates down the ballot to make big gains. If you are at less than 2 points in a riding and end up with over 60 points by the fifth ballot, that’s a huge gain over the course of five ballots. Thus the importance of second, third, and fourth choices.
Sam Sullivan’s support (1.82%) was not enough to trigger a realignment on the second count, so the next major move takes place on the third count.
Count 3
The results of the third count were dramatic, if you are a political nerd like me.
At this point, over 93% of the ballots were still in play. That means 7% of the voters – those who voted for either Sullivan or de Jong – did not put second choices on their ballots and therefore their ballots were removed from the count.
With Mike de Jong eliminated on the second count, the question was where would de Jong’s second choices go. A significant plurality went to Wilkinson.
de Jong finished the second count with 16.51% of the points. Wilkinson took almost 40% of de Jong’s points. He boosted his total from 18.74% to 25.29% – an increase of 6.55%.
The next closest gain was Dianne Watts who gained 3.5%, increasing to 28.38%. Lee kept pace with Watts, gaining 3.45% but did not gain any ground. Rather, he had Wilkinson breathing down his neck. Stone had the least amount of de Jong’s points and given that he was already in fourth place, he dropped off the ballot.
Wilkinson went from 1.62% in Abbotsford South to 29%, from 2.55% in Abbotsford West to 23.98%, from 2.91% in Surrey Whalley to 18.58%, from 10.99% in Peace South to 39.51%. Making gains in de Jong’s stronger ridings gave him that critical three point advantage on the third count. Now, he was less than 1% behind Lee.
Stone exited the third count with 20.29%, a significant amount considering how close the top three candidates were between each other, only separated by 3.9%.
Count 4
The fourth count decided who would be on the final ballot with Dianne Watts. Wilkinson was making a strong run up the ballot, but would it be enough? That’s what many were thinking.
At this point, the total amount of votes being counted was about 87% of the original pile. Watts, Lee, and Wilkinson would see their points rise on the basis of attrition but it was the remaining votes that would make the difference. (It’s worth noting that the Stone ‘votes’ also included those de Jong and Sullivan voters who went to Stone on the second and third counts)
Where would Stone’s points be allocated?
It turned out that they were competitively allocated between the three candidates with Wilkinson gaining 37.4% of Stone’s points, Lee 32.2%, and Watts 30.4%. And by the slimmest of margins, Wilkinson’s advantage over Lee made all of the difference.
The table below shows a regional breakdown of the fourth count and, below it, where the Stone votes went by region:
Table 6: (a) 4th count by region; (b) Growth from 3rd count to 4th count

On the fourth count, Watts had the most balance between the regions ranging from about 30% in the Interior to 38% on the Island, but she did not have a dominant base.
Lee’s strength was in the Lower Mainland where his support now stood at over 40% of points – in the largest region (48 seats). But his support on the Island and Interior was just over half of that. Wilkinson was opposite, weak in the Lower Mainland, but strong outside – and very strong in the Interior (47%) – and he made larger gains in these regions while not falling much further behind Lee in the Lower Mainland
On a points basis overall, it was a measly difference of 0.33% between Wilkinson and Lee. One third of one-percent. If Lee had pulled ahead, he would most likely be the Leader now.
Lee is dropped off the ballot despite leading Wilkinson by over 2000 raw votes. The table below shows the striking difference in the efficiency of the Lee and Wilkinson votes. There was an 8 point swing from Lee to Wilkinson based on the weighted points system. Watts was about on the mark when her raw vote and weighted was compared.
Table 7: Raw votes (%) on 4th count compared to weighted vote

Count 5
With Michael Lee eliminated, a few questions remained. Theories abounded. Where would his sizeable support among the South Asian community, Chinese community, and some who identify with his conservative background gravitate toward? Lee was winning Surrey – would those members opt for the former Mayor, Dianne Watts? In Vancouver, would Lee’s strength near his home riding (and in Quilchena) naturally gravitate toward Wilkinson?
Overall, the answer was clear – overwhelmingly to Wilkinson.
Of the remaining 6271 raw votes coming from Lee’s fourth count, they broke decisively toward Wilkinson – about 75% of Lee’s support went to Wilkinson (which is mainly Lee first choice support but there would be some first count Stone, de Jong, and Sullivan support in there too).
On the fourth count, Lee had 9787 raw votes, the most of any candidate. About 64% of those votes migrated to the fifth and final count, while 36% of Lee’s voters were removed as they did not indicate a choice of either Wilkinson or Watts.
Table 8: Distribution of Lee votes on 5th Count (raw votes)

(The * above recognizes that an estimated 82% or more of that total was Lee-first count support and the balance from de Jong, Stone, and Sullivan who went to Lee before moving on to Watts or Wilkinson)
Taking a look at Lee’s top 10 ridings on the fourth count, the migration in those ridings in terms of raw votes and points was significantly higher to Wilkinson. In Watts’ home base of Surrey, the Lee voters stampeded to Wilkinson, by a factor of 10 to 1 in some cases. The shift in the Surrey ridings below, and Delta North, was almost entirely from South Asian members (This shift was not replicated to same extent among Lee members in Richmond or Vancouver). The overall shift from Lee to Wilkinson allowed Wilkinson to rise from the basement in terms of support in the Lower Mainland to basically tie Watts in that region.
Table 9: Movement on 5th count in Lee’s top 10 ridings

This was the story of Wilkinson’s day. He, by far, had the lowest amount of first-count support as a percentage of final count support. Looking at raw votes, Wilkinson’s final count was made up only 38.5% of his first count support.
Table 10: First count as percentage of final count (raw votes)

Up until the fourth count, his growth from de Jong, Stone, and Sullivan was also significantly higher than Lee. On the fourth count, only 61.7% of his votes were his first choice votes, while Lee and Watts were at 82%. Wilkinson’s growth rate was twice the rate of the others, which is why he caught up. This was mainly attributable to de Jong’s second choices, but Stone’s second choices (which included some de Jong) also pitched in.
Table 11: Percentage of 1st, 2nd, and 3rd count support as % of 4th count support, and growth between 1st and 4th count

This series of tables above is based on raw votes to show how actual people moved. However, the actual results are based on weighted votes (points). Wilkinson almost tripled from the first count result while Watts almost doubled. Again, it was Wilkinson’s growth that was the key.
Table 12: First count votes as percentage of final count votes (weighted vote)

A further aspect of Wilkinson’s support was from his Caucus endorsers. He had the most compared to any other candidate. On the first count, he had about 37% support in his Caucus endorser ridings. To be specific, it was the Interior ridings where the Caucus endorsement seemed to make a difference, such as Kootenay East (68%) and Cariboo Chilcotin (59%). On the final count, that support in Caucus ridings grew to over 60%.
Perhaps it’s the fourth count where it is noteworthy.
In the 14 ridings where he had an endorsement (including his own), he had 47% of the points compared to Watts (27%) and Lee (19%). The difference between Wilkinson and Lee in these ridings was about 390 points. Wilkinson edged Lee by 30 points.
Yes, you can say the opposite. Lee had a considerable advantage in the Lower Mainland area compared to Wilkinson and had he edged him, we would be talking about that. We would be talking about Michael Lee (or Dianne Watts) who won the leadership despite any caucus endorsements. That’s true, but Wilkinson won and that’s, in part, how he did it. That was particularly the case from his endorsers in the Interior. In the Lower Mainland, Wilkinson won 2 of 5 ridings on the fourth count where he was endorsed (Coquitlam-Burke Mountain and Chilliwack-Kent).
Regionally, on the final count, Wilkinson would be strongest in the Interior (61.8%) but he grew in all regions as the counts unfolded, especially in the Lower Mainland. Starting at 12.1% on the first count, he had nowhere to go but up and finished in a near-tie with Watts in the region. He overtook Watts on the Island, while Watts never got close in the Interior.
Table 13: (a) Final count by region, (b) Growth from 1st count to final by region

What role did attrition play in the final result? Only three-quarters of voters who cast a a first choice vote had their ballot count on the final ballot. That’s akin to a quarter of the voters walking out of the room after their candidate was eliminated to, yes, have a cheeseburger.
With a smaller pile of votes in play, Watts’ first choice votes actually amounted to about 33% on the final count (her original first count vote divided by the remaining votes). Wilkinson’s first choice votes amounted to almost 25%. In order for Watts to win, she needed growth and shrinkage – growth from her rivals at the same time voter attrition made her original support higher. It wasn’t enough. Wilkinson’s growth from Lee on the final count overwhelmed the benefits of the shrinking pile.
Keys to Victory
After that laborious review of the numbers, what are the takeaways?
- Efficiency
The Wilkinson support was very efficient, meaning that they had a higher degree of support in lower-member ridings where votes had more impact. Strategy is often borne from necessity and Wilkinson made the most of his support.
- Interior Base
Wilkinson built a base of strong support in the Interior, which may seem counter-intuitive to casual observers given some try to brand him as a West-side elite. The Interior base was instrumental in getting him to third place on the ballot.
- deWilkinson deal
Once in third, Wilkinson could reap the rewards of the deWilkinson deal. Whether the deal made the difference, or it was just the nature of the deJong supporters to lean toward Wilkinson on their second choices will never be truly known. But one thing is clear – de Jong’s seconds put him in a position to springboard to second place. Even if Wilkinson had finished fourth on the first count, he may still have leapt ahead of Stone given the strength of deJong voters’ support for him. In 2011, de Jong’s second choices leaned heavily to Christy Clark and helped elect her Leader.
- Wilkinson was a Stone’s throw to second
Again, Wilkinson drew on down ballot support, not to the extent of deJong’s support, but enough that he could make it to second place. Wilkinson made important gains on the Island and Interior from Stone, but also kept pace in the Lower Mainland with Watts and Lee. The result was a bare 30 point edge over Lee to make it to second. To put that margin in perspective, had 13 voters in Peace River South switched from Wilkinson to Lee, Lee would have made it to the final ballot and likely have defeated Watts. It was that close. Slight changes in low-member ridings would have tipped the balance.
- No Lee-way for Watts
Watts needed 47% of Lee’s points to win. She only received 38% to Wilkinson’s 62%. It was a decisive move by (primarily) Lee voters to elect Wilkinson, and especially from Lee’s supporters in Surrey and North Delta.
In a race this close, there is no one reason why a candidate won or lost. There are a multitude. Yet we know that there is only one winner. Despite having the fifth highest number of raw votes on the first count, Wilkinson parlayed regional strength into a third place finish, allowing him to receive down ballot support from de Jong and Stone. He is not the first leader to trail on all ballots and win on the last – Andrew Scheer did it last year, trailing on 13 ballots before winning the 14th.
Wilkinson and his supporters will need to remember (as I’m sure they do) that they started off with 18.3% while 81.7% of the points were tied to another first choice. This makes his task all the more important in terms of reaching out, mending relationships, healing divisions, and ensuring rivals and their teams play important roles going forward. Dianne Watts came very close to winning and has a strong following throughout BC. Her strength in suburban swing ridings during this process should gain the attention of the backroom. Michael Lee has established himself as a force and emerging star on the provincial scene, adding to the depth that the new Leader has with Stone, de Jong, Sullivan, and the balance of Caucus. Wilkinson has the largest Opposition Caucus in history at his disposal, an electoral referendum to fight, and a general election that could happen anytime.
Congratulations to Andrew Wilkinson and his team. Moving from 18% to 53% over the course of five ballots does show one thing – just when we thought the Doctor-Lawyer-Rhodes Scholar could not be more educated, we may now have to add Mathematician to the list.
** There’s bound to be mistakes in this post somewhere. Errors all mine.
Addenda
Update: February 7
I have added some numbers. How did the leadership candidates do according to held seats and non-held seats?
Dianne Watts and Michael Lee had a combined 50.7% of the points in forty-one NDP ridings compared to a combined 43% in forty-three BC Liberal ridings (which includes Abbotsford South and Kelowna West for this analysis). This is similar to the 2011 result where Christy Clark did much better on non-held than held seats. The outsider candidates did not do as well in incumbent ridings.
Andrew Wilkinson and Todd Stone were stronger in BC Liberal ridings, Wilkinson especially so. Wilkinson was 2nd in BC Liberal ridings and 4th in NDP ridings. There are only three Green ridings so Watts’ advantage was not as important though Todd Stone wishes it was the case – it does reflect that Stone had some strength on the Island.
Table 14: First count leadership vote by BC Liberal, NDP, and Green ridings

On the fifth count, Wilkinson led in BC Liberal and NDP ridings, but moreso in the held seats. Watts held her advantage in the three Green ridings.
Table 15: Fifth count leadership vote by BC Liberal, NDP, and Green ridings

Update: February 8
Some more calculations to add to the mix.
Table 16: First count, raw vote by sub-region

Table 16 shows the raw vote in each sub-region. In the left-hand column, the number of ridings in that region is included for reference. The most votes cast overall were in the Surrey-Delta area (686 per riding) followed by Vancouver (402) and then three regions that were very close together: Fraser Valley (390), Southern Interior (389), and Richmond (381).
Table 17: First count – Candidate raw votes in each sub-region as a percentage of each candidate’s province-wide vote.

Okay, let me explain. This table shows what percentage of each candidate’s support came from each sub-region as a percentage of that candidate’s province-wide vote. Of all the people that voted for Watts, 35% came from Surrey-Delta’s 11 ridings – the same as Michael Lee. Stone had 35.1% of his province-wide raw vote come from the Southern Interior (and, actually, extremely high in Kamloops area). For reference, the right hand column shows what percentage of the weighted vote each sub-region made up as part of province-wide total. De Jong’s best region was the Fraser Valley (23.1% of all of his votes in BC), and that sub-region only accounted for 10.3% of the weighted vote so, yes, de Jong did quite well there. As I write this, I’m yawning. This is borderline pointless but I will leave it for the die hards.
Table 18: First count – Average raw vote per riding, by sub-region

This is more straightforward. Here are the raw votes per riding in each sub-region. You can see here where a little could make a lot of difference. Watts was 1st, 2nd, or 3rd in each region. Lee led four Metro Vancouver regions (Vancouver, Surrey, Richmond, North East sector), but was fourth or fifth outside the Lower Mainland. Wilkinson won the North, Kootenays, and was second in the Southern Interior and Island, while he did no better than third in the Lower Mainland sub-regions.
Table 19: Candidate raw vote increase per ballot

This table shows the distribution of raw votes per ballot and which candidate had the most members migrating in their direction. On the second ballot, Michael Lee had the most Sam Sullivan supporters choosing him as their second choice (25.2%) with Andrew Wilkinson close behind. On the third ballot, over half of the redistributed ballots went to Wilkinson, almost all from de Jong (though there were some Sullivan third choices who came to him via de Jong). On the fourth ballot, Wilkinson also gained the most in terms of raw votes, edging Lee. On the fifth ballot, almost three-quarters of redistributed raw votes chose Wilkinson. Another aspect of Table 19 is how many ballots were retained through each count. Over 96% of Sullivan voters carried on to the second count. On the third count, on 61% of de Jong voters stuck around. When Todd Stone dropped off, almost three-quarters (74%) carried on to a further choice and, on the fifth count, almost 80% carried on to provide another choice.
Table 20: Candidate share of point increase per ballot

Table 20 shows the distribution of points to each candidate following the removal of a candidate. Like Table 19, it shows Wilkinson’s growth. What’s interesting is that Wilkinson actually had more movement in terms of raw votes as he grew through the third, fourth, and fifth ballots than he did in terms of points. He had over half of the redistributed raw votes in round 3 but only 40% of the points. In round 5, he had almost 75% of redistributed raw votes but only 62% of redistributed points. Wilkinson had started out with a high efficiency on the first count, but became less efficient as the ballots wore on. This is basically a math issue where the support he was receiving on second and third choices were, in many cases, from members in high-member ridings.

Very well done Dr. McDonald! Thank you.
Netty
LikeLiked by 1 person
Wow…my first personal experience with such a system of voting. Two take aways. #1 rank ALL the candidates. #2 don’t over think it . It’s not worth the effort.
LikeLike
Great points as always Mike.
“Wilkinson and his supporters will need to remember (as I’m sure they do) that they started off with 18.3% while 81.7% of the points were tied to another first choice.” This is even more emphasized when you look at the first ballot vote totals rather than points which arguably more relevant as it it the number of people who did not select Wilkinson as first choice.
Lee – 8100 (26.3%)
Watts – 7449 (24.4%)
Stone – 5073 (16.5%)
de Jong – 4837(15.7%)
Wilkinson – 4828 (15.7%)
Sullivan – 488 (1.6%)
I don’t think Wilkinson will have much trouble pulling the party together – from opposition members have one common goal – to get back in government and defeat the NDP – and Wilkinson will be a vocal and strong advocate for it.
LikeLike
Great analysis, Mike! Thanks for the breakdown
LikeLike
Hi Mike, throwing numbers around like this makes me think that you could still join me as an accountant ! Good analysis and it’s certainly a more complicated voting system than I think a lot of people appreciate. However, overall certainly a good use of modern technology to improve the democratic process. Hope you are well – I fondly remember the old days in Port Moody Burnaby – Mt. !
LikeLike
Thanks Jim! I appreciate the comments and remember the Port Moody-Bby Mtn campaign well. But for a few hundred votes, Christy Clark would have had to have looked elsewhere for a seat in 1996. Liberal parachutes were flying all over BC in ’91 and some almost parachuted through the dome of the Legislature as well. I hope you caught my piece on the that campaign (https://rosedeer.wordpress.com/2016/10/17/1991-the-election-that-transformed-bc-politics/). Best regards.
LikeLike
Thank you for an answer to a complicated but fair voting system..
LikeLike